BP 2015 Annual Report Download - page 41
Download and view the complete annual report
Please find page 41 of the 2015 BP annual report below. You can navigate through the pages in the report by either clicking on the pages listed below, or by using the keyword search tool below to find specific information within the annual report.-
 1
1 -
2
-
3
-
4
-
5
-
6
-
7
-
8
-
9
-
10
-
11
-
12
-
13
-
14
-
15
-
16
-
17
-
18
-
19
-
20
-
21
-
22
-
23
-
24
-
25
-
26
-
27
-
28
-
29
-
30
-
 31
31 -
 32
32 -
 33
33 -
 34
34 -
 35
35 -
 36
36 -
 37
37 -
 38
38 -
 39
39 -
 40
40 -
 41
41 -
 42
42 -
 43
43 -
 44
44 -
 45
45 -
 46
46 -
 47
47 -
 48
48 -
 49
49 -
 50
50 -
 51
51 -
52
-
53
-
54
-
55
-
56
-
57
-
58
-
59
-
60
-
61
-
62
-
63
-
64
-
65
-
66
-
67
-
68
-
69
-
70
-
71
-
72
-
73
-
74
-
75
-
76
-
77
-
78
-
79
-
80
-
81
-
82
-
83
-
84
-
85
-
86
-
87
-
88
-
89
-
90
-
91
-
92
-
93
-
94
-
95
-
96
-
97
-
98
-
99
-
100
-
101
-
102
-
103
-
104
-
105
-
106
-
107
-
108
-
109
-
110
-
111
-
112
-
113
-
114
-
115
-
116
-
117
-
118
-
119
-
120
-
121
-
122
-
123
-
124
-
125
-
126
-
127
-
128
-
129
-
130
-
131
-
132
-
133
-
134
-
135
-
136
-
137
-
138
-
139
-
140
-
141
-
142
-
143
-
144
-
145
-
146
-
147
-
148
-
149
-
150
-
151
-
152
-
153
-
154
-
155
-
156
-
157
-
158
-
159
-
160
-
161
-
162
-
163
-
164
-
165
-
166
-
167
-
168
-
169
-
170
-
171
-
172
-
173
-
174
-
175
-
176
-
177
-
178
-
179
-
180
-
181
-
182
-
183
-
184
-
185
-
186
-
187
-
188
-
189
-
190
-
191
-
192
-
193
-
194
-
195
-
196
-
197
-
198
-
199
-
200
-
201
-
202
-
203
-
204
-
205
-
206
-
207
-
208
-
209
-
210
-
211
-
212
-
213
-
214
-
215
-
216
-
217
-
218
-
219
-
220
-
221
-
222
-
223
-
224
-
225
-
226
-
227
-
228
-
229
-
230
-
231
-
232
-
233
-
234
-
235
-
236
-
237
-
238
-
239
-
240
-
241
-
242
-
243
-
244
-
245
-
246
-
247
-
248
-
249
-
250
-
251
-
252
-
253
-
254
-
255
-
256
-
257
-
258
-
259
-
260
-
261
-
262
-
263
-
264
-
265
-
266
 |
 |

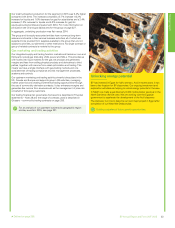
First, it seeks to identify the best markets and prices for our crude oil,
source optimal raw materials for our refineries and provide competitive
supply for our marketing businesses. We will often sell our own crude and
purchase alternative crudes from third parties for our refineries where this
will provide incremental margin.
Second, it aims to create and capture incremental trading opportunities by
entering into a full range of exchange-traded commodity derivatives,
over-the-counter contracts and spot and term contracts. In combination
with rights to access storage and transportation capacity, this allows it to
access advantageous price differences between locations and time
periods, and to arbitrage between markets.
The function has trading offices in Europe, North America and Asia. Our
presence in the more actively traded regions of the global oil markets
supports overall understanding of the supply and demand forces across
these markets.
Our trading financial risk governance framework is described in Financial
statements – Note 28 and the range of contracts used is described in
Glossary – commodity trading contracts on page 256.
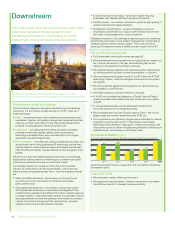
Aviation
Air BP’s strategic aim is to continue to hold strong positions in our core
locations of Europe and the US, while expanding our portfolio in airports
that offer long-term competitive advantage in material growing markets
such as Asia and South America. We are one of the world’s largest global
aviation fuels suppliers. Air BP serves many major commercial airlines as
well as the general aviation sectors. We have marketing sales of more than
430,000 barrels per day and we added more than 70 airports to our global
network with the acquisition of Statoil Fuel & Retail’s aviation business.
Our lubricants business
Our lubricants strategy is to focus on our premium brands and growth
markets while leveraging technology and customer relationships. With
more than 50% of profit generated from growth markets and continued
growth in premium lubricants, we have an excellent base for further
expansion and sustained profit growth.
Our lubricants business manufactures and markets lubricants and related
products and services to the automotive, industrial, marine and energy
markets across the world. Our key brands are Castrol, BP and Aral. Castrol
is a recognized brand worldwide that we believe provides us with
significant competitive advantage. In technology, we apply our expertise to
create differentiated, premium lubricants and high-performance fluids for
customers in on-road, off-road, sea and industrial applications globally.
We are one of the largest purchasers of base oil in the market, but have
chosen not to produce it or manufacture additives at scale. Our
participation choices in the value chain are focused on areas where we can
leverage competitive differentiation and strength, such as:
• Applying cutting-edge technologies in the development and formulation
of advanced products.
• Creating and developing product brands and clearly communicating their
benefits to customers.
• Building and extending our relationships with customers to better
understand and meet their needs.
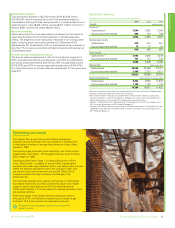
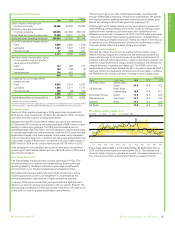
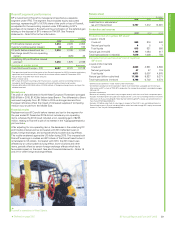
The lubricants business delivered an underlying RC profit before interest
and tax which was higher than 2014 and 2013. The 2015 result reflected
strong performance in growth markets and premium brands and lower
costs from simplification and efficiency programmes. These factors
contributed to around a 20% year-on-year improvement in results, which
was partially offset by adverse foreign exchange impacts. The 2014 result
benefited from improved margins across the portfolio, offset by adverse
foreign exchange impacts.
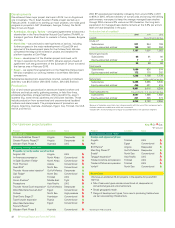
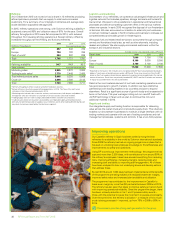
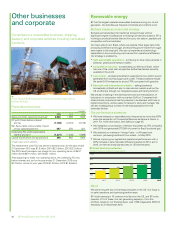
Our petrochemicals business
Our petrochemicals strategy is to improve our earnings potential and make
the business more resilient to a bottom-of-cycle environment. We develop
proprietary technology to deliver leading cost positions compared with our
competition. We manufacture and market four main product lines:
• Purified terephthalic acid (PTA).
• Paraxylene (PX).
• Acetic acid.
• Olefins and derivatives.
We also produce a number of other specialty petrochemicals products.
We aim to reposition our portfolio, improve operating performance and
create efficiency benefits. We are taking steps to significantly improve the
resilience of the business to a bottom-of-cycle environment by:
• Restructuring a significant portion of our portfolio, primarily in our
aromatics business, to shut down older capacity in the US and Asia and
assess disposal options for less advantaged assets.
• Retrofitting our best technology in our advantaged sites to reduce overall
operating costs.
• Growing third-party licensing income to create additional value.
• Delivering operational improvements focused on turnaround efficiency
and improved reliability.
• Delivering value through simplification and efficiency programmes.
In addition to the assets we own and operate, we have also invested in a
number of joint arrangements in Asia, where our partners are leading
companies in their domestic market. We are licensing our distinctive
technologies, including recently announced licensing agreements for our
latest generation PTA technology in Oman and China.
In 2015 the petrochemicals business delivered a higher underlying RC
profit before interest and tax compared with 2014 and 2013. The result
reflected improved operational performance and benefits from our
simplification and efficiency programmes leading to lower costs.
Compared with 2013, the 2014 result was lower, reflecting a continuation
of the weak margin environment, particularly in the Asian aromatics sector,
and unplanned operational events.
Our petrochemicals production of 14.8 million tonnes in 2015 was
higher than 2014 and 2013 (2014 14.0mmte, 2013 13.9mmte), with the low
margin environment in 2014 and 2013 driving reduced output.
In 2015, our Zhuhai 3 PTA plant in China was fully commissioned adding
1.25 million tonnes of production capacity to our petrochemicals portfolio.
During the year we also shut down older capacity of certain units in the US
and Asia.
We are upgrading our PTA plants at Cooper River in South Carolina, US and
Geel in Belgium using our latest proprietary technology. We expect these
investments to significantly increase manufacturing efficiency at these
facilities. We plan to continue deploying our technology in new asset
platforms to access Asian demand and advantaged feedstock sources.
We announced in January 2016 that we had reached an agreement to
sell our Decatur petrochemicals complex in Alabama, US, as part of
our strategy to refocus our global petrochemicals business for
long-term growth.
Defined on page 256.BP Annual Report and Form 20-F 2015 37
Strategic report