BP 2015 Annual Report Download - page 128
Download and view the complete annual report
Please find page 128 of the 2015 BP annual report below. You can navigate through the pages in the report by either clicking on the pages listed below, or by using the keyword search tool below to find specific information within the annual report.-
 1
1 -
2
-
3
-
4
-
5
-
6
-
7
-
8
-
9
-
10
-
11
-
12
-
13
-
14
-
15
-
16
-
17
-
18
-
19
-
20
-
21
-
22
-
23
-
24
-
25
-
26
-
27
-
28
-
29
-
30
-
31
-
32
-
33
-
34
-
35
-
36
-
37
-
38
-
39
-
40
-
41
-
42
-
43
-
44
-
45
-
46
-
47
-
48
-
49
-
50
-
51
-
52
-
53
-
54
-
55
-
56
-
57
-
58
-
59
-
60
-
61
-
62
-
63
-
64
-
65
-
66
-
67
-
68
-
69
-
70
-
71
-
72
-
73
-
74
-
75
-
76
-
77
-
78
-
79
-
80
-
81
-
82
-
83
-
84
-
85
-
86
-
87
-
88
-
89
-
90
-
91
-
92
-
93
-
94
-
95
-
96
-
97
-
98
-
99
-
100
-
101
-
102
-
103
-
104
-
105
-
106
-
107
-
108
-
109
-
110
-
111
-
112
-
113
-
114
-
115
-
116
-
117
-
 118
118 -
 119
119 -
 120
120 -
 121
121 -
 122
122 -
 123
123 -
 124
124 -
 125
125 -
 126
126 -
 127
127 -
 128
128 -
 129
129 -
 130
130 -
 131
131 -
 132
132 -
 133
133 -
 134
134 -
 135
135 -
 136
136 -
 137
137 -
 138
138 -
139
-
140
-
141
-
142
-
143
-
144
-
145
-
146
-
147
-
148
-
149
-
150
-
151
-
152
-
153
-
154
-
155
-
156
-
157
-
158
-
159
-
160
-
161
-
162
-
163
-
164
-
165
-
166
-
167
-
168
-
169
-
170
-
171
-
172
-
173
-
174
-
175
-
176
-
177
-
178
-
179
-
180
-
181
-
182
-
183
-
184
-
185
-
186
-
187
-
188
-
189
-
190
-
191
-
192
-
193
-
194
-
195
-
196
-
197
-
198
-
199
-
200
-
201
-
202
-
203
-
204
-
205
-
206
-
207
-
208
-
209
-
210
-
211
-
212
-
213
-
214
-
215
-
216
-
217
-
218
-
219
-
220
-
221
-
222
-
223
-
224
-
225
-
226
-
227
-
228
-
229
-
230
-
231
-
232
-
233
-
234
-
235
-
236
-
237
-
238
-
239
-
240
-
241
-
242
-
243
-
244
-
245
-
246
-
247
-
248
-
249
-
250
-
251
-
252
-
253
-
254
-
255
-
256
-
257
-
258
-
259
-
260
-
261
-
262
-
263
-
264
-
265
-
266
 |
 |

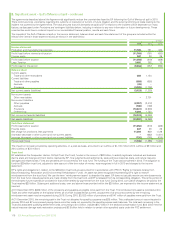
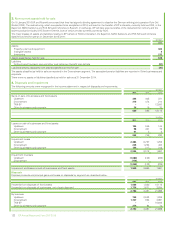
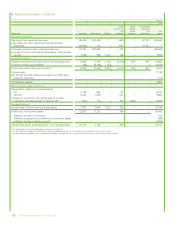
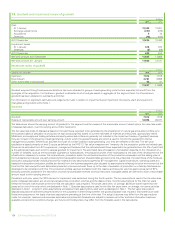
4. Disposals and impairment – continued
assets. The impairments in the North Sea and Angola arose as a result of a lower price environment in the near term, technical reserves revisions, and
increases in expected decommissioning cost estimates. The impairment of Block KG D6 arose following the introduction of a new formula for Indian
gas prices. The discount rate used to determine the value in use of the PSVM CGU included the 2% premium for higher-risk countries. A premium was
not applied in determining the recoverable amount of the other CGUs.
The main elements of the 2013 impairment losses of $1,255 million were a $251-million impairment loss relating to the Browse project in Australia and
a $253-million aggregate write-down of a number of assets in the North Sea, caused by increases in expected decommissioning costs. Impairment
reversals arose on certain of our interests in Alaska, the Gulf of Mexico, and the North Sea, triggered by reductions in decommissioning provisions due
to continued review of the expected decommissioning costs and an increase in the discount rate for provisions.
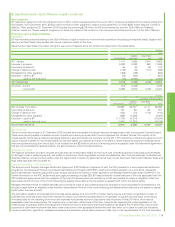
Downstream
The 2015 impairment losses of $265 million arose principally in relation to certain manufacturing assets in our petrochemicals business and certain US
midstream assets, where the expected disposal proceeds were lower than the book values.
The 2014 impairment losses of $1,264 million principally related to our Bulwer Island refinery and certain midstream assets in our fuels business, and
certain manufacturing assets in our petrochemicals business.
The 2013 impairment losses of $484 million principally related to impairments of certain refineries in the US and elsewhere in our global fuels portfolio.
Other businesses and corporate
Impairment losses totalling $155 million, $317 million, and $218 million were recognized in 2015, 2014 and 2013 respectively. The amount for 2015 is
principally in respect of our US wind business. The amount for 2014 is principally in respect of our biofuels businesses in the UK and US. The amount
for 2013 is principally in respect of our US wind business.
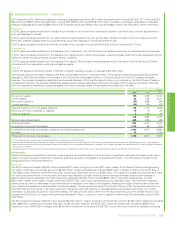
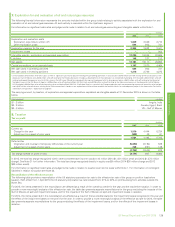
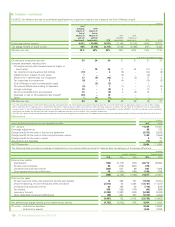
5. Segmental analysis
The group’s organizational structure reflects the various activities in which BP is engaged. At 31 December 2015, BP had three reportable segments:
Upstream, Downstream and Rosneft.
Upstream’s activities include oil and natural gas exploration, field development and production; midstream transportation, storage and processing; and
the marketing and trading of natural gas, including liquefied natural gas (LNG), together with power and natural gas liquids (NGLs).
Downstream’s activities include the refining, manufacturing, marketing, transportation, and supply and trading of crude oil, petroleum, petrochemicals
products and related services to wholesale and retail customers.
During 2013, BP completed transactions for the sale of BP’s interest in TNK-BP to Rosneft, and for BP’s further investment in Rosneft. BP’s interest in
Rosneft is accounted for using the equity method and is reported as a separate operating segment, reflecting the way in which the investment is
managed.
Other businesses and corporate comprises the biofuels and wind businesses, the group’s shipping and treasury functions, and corporate activities
worldwide.
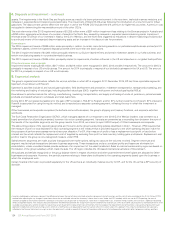
The Gulf Coast Restoration Organization (GCRO), which manages aspects of our response to the 2010 Gulf of Mexico incident, was overseen by a
board committee for all periods presented, however it is not an operating segment. Its costs are presented as a reconciling item between the sum of
the results of the reportable segments and the group results. From 2016, we intend to report GCRO as part of Other businesses and corporate.
The accounting policies of the operating segments are the same as the group’s accounting policies described in Note 1. However, IFRS requires that
the measure of profit or loss disclosed for each operating segment is the measure that is provided regularly to the chief operating decision maker for
the purposes of performance assessment and resource allocation. For BP, this measure of profit or loss is replacement cost profit or loss before
interest and tax which reflects the replacement cost of supplies by excluding from profit or loss inventory holding gains and lossesa. Replacement cost
profit or loss for the group is not a recognized measure under IFRS.
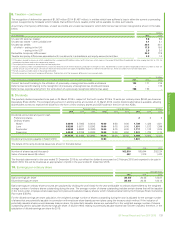
Sales between segments are made at prices that approximate market prices, taking into account the volumes involved. Segment revenues and
segment results include transactions between business segments. These transactions and any unrealized profits and losses are eliminated on
consolidation, unless unrealized losses provide evidence of an impairment of the asset transferred. Sales to external customers by region are based on
the location of the group subsidiary which made the sale. The UK region includes the UK-based international activities of Downstream.
All surpluses and deficits recognized on the group balance sheet in respect of pension and other post-retirement benefit plans are allocated to Other
businesses and corporate. However, the periodic expense relating to these plans is allocated to the operating segments based upon the business in
which the employees work.
Certain financial information is provided separately for the US as this is an individually material country for BP, and for the UK as this is BP’s countryof
domicile.
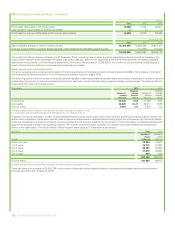
aInventory holding gains and losses represent the difference between the cost of sales calculated using the replacement cost of inventory and the cost of sales calculated on the first-in first-out (FIFO)
method after adjusting for any changes in provisions where the net realizable value of the inventory is lower than its cost. Under the FIFO method, which we use for IFRS reporting, the cost of
inventory charged to the income statement is based on its historical cost of purchase or manufacture, rather than its replacement cost. In volatile energy markets, this can have a significant distorting
effect on reported income. The amounts disclosed represent the difference between the charge to the income statement for inventory on a FIFO basis (after adjusting for any related movements in net
realizable value provisions) and the charge that would have arisen based on the replacement cost of inventory. For this purpose, the replacement cost of inventory is calculated using data from each
operation’s production and manufacturing system, either on a monthly basis, or separately for each transaction where the system allows this approach. The amounts disclosed are not separately
reflected in the financial statements as a gain or loss. No adjustment is made in respect of the cost of inventories held as part of a trading position and certain other temporary inventory positions.
124 BP Annual Report and Form 20-F 2015