BP 2015 Annual Report Download - page 26
Download and view the complete annual report
Please find page 26 of the 2015 BP annual report below. You can navigate through the pages in the report by either clicking on the pages listed below, or by using the keyword search tool below to find specific information within the annual report.-
 1
1 -
2
-
3
-
4
-
5
-
6
-
7
-
8
-
9
-
10
-
11
-
12
-
13
-
14
-
15
-
 16
16 -
 17
17 -
 18
18 -
 19
19 -
 20
20 -
 21
21 -
 22
22 -
 23
23 -
 24
24 -
 25
25 -
 26
26 -
 27
27 -
 28
28 -
 29
29 -
 30
30 -
 31
31 -
 32
32 -
 33
33 -
 34
34 -
 35
35 -
 36
36 -
37
-
38
-
39
-
40
-
41
-
42
-
43
-
44
-
45
-
46
-
47
-
48
-
49
-
50
-
51
-
52
-
53
-
54
-
55
-
56
-
57
-
58
-
59
-
60
-
61
-
62
-
63
-
64
-
65
-
66
-
67
-
68
-
69
-
70
-
71
-
72
-
73
-
74
-
75
-
76
-
77
-
78
-
79
-
80
-
81
-
82
-
83
-
84
-
85
-
86
-
87
-
88
-
89
-
90
-
91
-
92
-
93
-
94
-
95
-
96
-
97
-
98
-
99
-
100
-
101
-
102
-
103
-
104
-
105
-
106
-
107
-
108
-
109
-
110
-
111
-
112
-
113
-
114
-
115
-
116
-
117
-
118
-
119
-
120
-
121
-
122
-
123
-
124
-
125
-
126
-
127
-
128
-
129
-
130
-
131
-
132
-
133
-
134
-
135
-
136
-
137
-
138
-
139
-
140
-
141
-
142
-
143
-
144
-
145
-
146
-
147
-
148
-
149
-
150
-
151
-
152
-
153
-
154
-
155
-
156
-
157
-
158
-
159
-
160
-
161
-
162
-
163
-
164
-
165
-
166
-
167
-
168
-
169
-
170
-
171
-
172
-
173
-
174
-
175
-
176
-
177
-
178
-
179
-
180
-
181
-
182
-
183
-
184
-
185
-
186
-
187
-
188
-
189
-
190
-
191
-
192
-
193
-
194
-
195
-
196
-
197
-
198
-
199
-
200
-
201
-
202
-
203
-
204
-
205
-
206
-
207
-
208
-
209
-
210
-
211
-
212
-
213
-
214
-
215
-
216
-
217
-
218
-
219
-
220
-
221
-
222
-
223
-
224
-
225
-
226
-
227
-
228
-
229
-
230
-
231
-
232
-
233
-
234
-
235
-
236
-
237
-
238
-
239
-
240
-
241
-
242
-
243
-
244
-
245
-
246
-
247
-
248
-
249
-
250
-
251
-
252
-
253
-
254
-
255
-
256
-
257
-
258
-
259
-
260
-
261
-
262
-
263
-
264
-
265
-
266
 |
 |

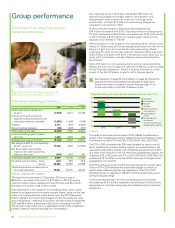
Strategy, performance and pay
In a difficult environment, BP’s leadership delivered strong operating performance,
based on a sound strategy and consistently improved safety performance. They have
acted early and decisively in response to low oil prices to preserve future growth.
In an ever more challenging world BP executives
performed strongly in 2015 in managing the
things they could control and for which they
were accountable. BP was one of the first to
recognize the shift to a ’lower for longer’ price
environment and through early action delivered
distinctive competitive performance on costs.
Momentum built through the year in
simplification and efficiencies, such that
operating cash flow significantly exceeded plan.
Assets ran well and major projects★ were
commissioned on time. Good performance on
safety has led to sound and reliable operations.
There has been a high quality of execution.
Our pay structure is relatively simple and reflects
a number of key overriding principles. It is
long-term, performance-based and tied directly
to strategy and delivery. It is biased towards
equity with long retention periods. This is
reflected in the policy framework that was
approved by shareholders in 2014. Variable
remuneration is primarily based on true
underlying performance and not driven by
factors over which the executives have no
control. Consistent with past practice, we
Highlights of the year
Strong safety and operational performance in a difficult environment
• Responded early and decisively to lower oil price environment.
• Excellent safety standards with continuous improvement over the past three years, leading to
improvements in reliability and operations.
• Strong operating cash flow★ and underlying replacement cost profit relative to plan.
• Net investment managed aggressively to reflect ‘lower for longer’ oil price environment.
• Executive directors’ pay outcomes reflect strong operating performance relative to plan.
• Alignment between executives and shareholders with the majority of executive director
remuneration paid in equity with lengthy retention requirements.
These pages constitute the remuneration
committee chair’s annual statement which
forms part of the Directors’ remuneration
report, the rest of which can be found on
page 76.
For more information on the group’s key
performance indicators see page 20.
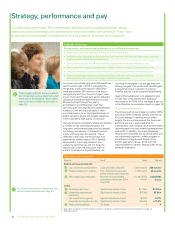
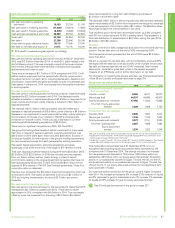
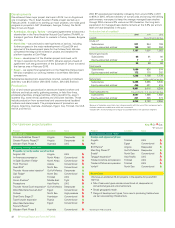
Short-term: annual bonus
Measure Result Target Outcome
Safety and operational risk
Loss of primary containment Spills and leaks declined.≤ 253 events 208 eventsa
Process safety tier 1 events The most serious process
safety events were reduced.
≤ 29 events 20 events
Recordable injury frequency Number of work-related
recordable injuries per 200k
hours fell.
≤ 0.261/200k
hoursb
0.223/200k
hoursb
Value
Operating cash flow Significantly ahead of plan. $17.2bn $19.1bn
Underlying replacement
cost profit
Significantly ahead of plan. $4.2bn $5.9bn
Net investment (organic) Significantly ahead of plan. 18% 27%
Corporate and functional costs Significantly ahead of plan.5.9% 17.6%
Major project delivery On target. 44
a Adjusted in accordance with the treatment of the loss of primary containment key performance indicator on page 20.
b Excludes biofuels.
normalize for changes in oil and gas price and
refining margins. This avoids both windfall gains
and punitive losses in periods of extreme
volatility such as we are currently experiencing.
Against this background, I am pleased to give
an overview of key elements of executive
remuneration for 2015. All of the detail is set out
in the Directors’ remuneration report on page 76.
Short-term performance
The annual cash bonus is based on safety (30%)
and value (70%) measures directly linked to our
KPIs and strategy. In setting annual safety
targets, the committee reviews the three-year
performance and in each case aims for
improvement. We measure value by reference to
operating cash flow and underlying replacement
cost profit. In addition, two value measures,
reductions in corporate and functional costs and
net investment (organic)★, reflect progress in
simplification. Targets were based on the
board’s plan set in January 2015, with the
maxima tested for stretch. Results were strong
across all measures.
BP Annual Report and Form 20-F 201522