BP 2015 Annual Report Download - page 205
Download and view the complete annual report
Please find page 205 of the 2015 BP annual report below. You can navigate through the pages in the report by either clicking on the pages listed below, or by using the keyword search tool below to find specific information within the annual report.-
 1
1 -
2
-
3
-
4
-
5
-
6
-
7
-
8
-
9
-
10
-
11
-
12
-
13
-
14
-
15
-
16
-
17
-
18
-
19
-
20
-
21
-
22
-
23
-
24
-
25
-
26
-
27
-
28
-
29
-
30
-
31
-
32
-
33
-
34
-
35
-
36
-
37
-
38
-
39
-
40
-
41
-
42
-
43
-
44
-
45
-
46
-
47
-
48
-
49
-
50
-
51
-
52
-
53
-
54
-
55
-
56
-
57
-
58
-
59
-
60
-
61
-
62
-
63
-
64
-
65
-
66
-
67
-
68
-
69
-
70
-
71
-
72
-
73
-
74
-
75
-
76
-
77
-
78
-
79
-
80
-
81
-
82
-
83
-
84
-
85
-
86
-
87
-
88
-
89
-
90
-
91
-
92
-
93
-
94
-
95
-
96
-
97
-
98
-
99
-
100
-
101
-
102
-
103
-
104
-
105
-
106
-
107
-
108
-
109
-
110
-
111
-
112
-
113
-
114
-
115
-
116
-
117
-
118
-
119
-
120
-
121
-
122
-
123
-
124
-
125
-
126
-
127
-
128
-
129
-
130
-
131
-
132
-
133
-
134
-
135
-
136
-
137
-
138
-
139
-
140
-
141
-
142
-
143
-
144
-
145
-
146
-
147
-
148
-
149
-
150
-
151
-
152
-
153
-
154
-
155
-
156
-
157
-
158
-
159
-
160
-
161
-
162
-
163
-
164
-
165
-
166
-
167
-
168
-
169
-
170
-
171
-
172
-
173
-
174
-
175
-
176
-
177
-
178
-
179
-
180
-
181
-
182
-
183
-
184
-
185
-
186
-
187
-
188
-
189
-
190
-
191
-
192
-
193
-
194
-
 195
195 -
 196
196 -
 197
197 -
 198
198 -
 199
199 -
 200
200 -
 201
201 -
 202
202 -
 203
203 -
 204
204 -
 205
205 -
 206
206 -
 207
207 -
 208
208 -
 209
209 -
 210
210 -
 211
211 -
 212
212 -
 213
213 -
 214
214 -
 215
215 -
216
-
217
-
218
-
219
-
220
-
221
-
222
-
223
-
224
-
225
-
226
-
227
-
228
-
229
-
230
-
231
-
232
-
233
-
234
-
235
-
236
-
237
-
238
-
239
-
240
-
241
-
242
-
243
-
244
-
245
-
246
-
247
-
248
-
249
-
250
-
251
-
252
-
253
-
254
-
255
-
256
-
257
-
258
-
259
-
260
-
261
-
262
-
263
-
264
-
265
-
266
 |
 |

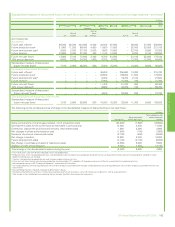
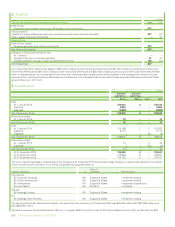
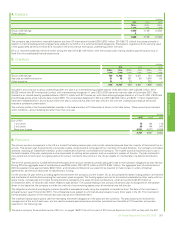
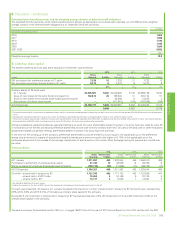
4. Debtors
$ million
2015 2014 2013
Within
1 year
Within
1year
Within
1year
Group undertakings 1,059 7,159 21,550
Other debtors 3––
1,062 7,159 21,550
The company has a short-term receivable balance due from BP International Limited (2015 $757 million; 2014 $6,712 million) that arises primarily in
relation to internal trading partner arrangements utilized to fund BP p.l.c.’s external dividend obligations. This balance, together with the carrying value
of the guarantees as set out in Note 9, is included in the amounts due from group undertakings within one year.
BP p.l.c. received dividends of $1,618 million during the year (2014 $2,129 million), with the company also making dividend payments as set out in
Note 9 to the consolidated financial statements.
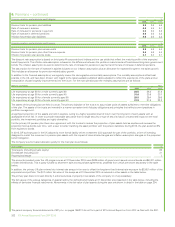
5. Creditors
$ million
2015 2014 2013
Within
1 year
After
1 year
Within
1year
After
1year
Within
1year
After
1year
Group undertakings 100 6,708 140 6,871 184 6,895
Accruals and deferred income 81 33 391 90 1,540 58
Other creditors 31 – 28 – 232 –
212 6,741 559 6,961 1,956 6,953
Included in amounts due to group undertakings after one year is an interest-bearing payable balance of $4,236 million (2014 $4,236 million, 2013
$4,236 million) with BP International Limited, with interest being charged at a 1 year USD LIBOR rate and a maturity date of December 2021. Also
included is an interest-bearing payable balance of $2,311 million with BP Finance plc, with interest being charged based on a 3 month USD LIBOR rate
plus 55 basis points and a maturity date of April 2020. The comparative balances for 2014 and 2013 ($2,308 million and $2,311 million respectively)
have been reclassified from amounts due within one year to amounts due after one year; this is in line with the underlying contractual terms and
ensures a consistent presentation.
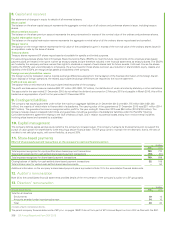
The maturity profile of the financial liabilities included in the balance sheet at 31 December is shown in the table below. These amounts are included
within Creditors – amounts falling due after more than one year.
$ million
2015 2014 2013
Due within
1 to 2 years 75 154 110
2 to 5 years 85 184 204
More than 5 years 6,581 6,623 6,639
6,741 6,961 6,953
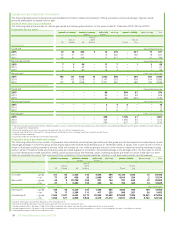
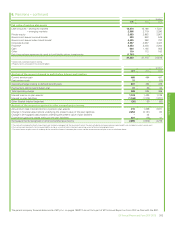
6. Pensions
The primary pension arrangement in the UK is a funded final salary pension plan under which retired employees draw the majority of their benefit as an
annuity. This pension plan is governed by a corporate trustee whose board is composed of four member-nominated directors, four company-nominated
directors, including an independent director, and an independent chairman nominated by the company. The trustee board is required by law to act in
the best interests of the plan participants and is responsible for setting certain policies, such as investment policies of the plan. The plan is closedto
new joiners but remains open to ongoing accrual for current members. New joiners in the UK are eligible for membership of a defined contribution
plan.
The level of contributions to funded defined benefit plans is the amount needed to provide adequate funds to meet pension obligations as they fall due.
During 2015 the aggregate level of contributions was $754 million (2014 $713 million and 2013 $ 597 million). The aggregate level of contributions in
2016 is expected to be approximately $463 million, and includes contributions we expect to be required to make by law or under contractual
agreements, as well as an allowance for discretionary funding.
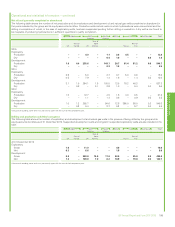
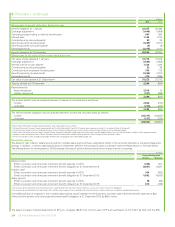
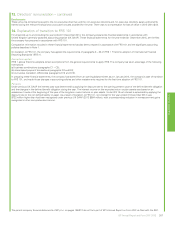
For the primary UK plan there is a funding agreement between the company and the trustee. On an annual basis the latest funding position is reviewed
and a schedule of contributions covering the next seven years is agreed. The funding agreement can be terminated unilaterally by either party with two
years’ notice. Contractually committed funding therefore represents nine years of future contributions, which amounted to $4,374 million at
31 December 2015, of which $1,437 million relates to past service. The surplus relating to the primary UK pension plan is recognized on the balance
sheet on the basis that the company is entitled to a refund of any remaining assets once all members have left the plan.
The obligation and cost of providing the pension benefits is assessed annually using the projected unit credit method. The date of the most recent
actuarial review was 31 December 2015. The principal plans are subject to a formal actuarial valuation every three years in the UK. The most recent
formal actuarial valuation of the main pension plan was as at 31 December 2014.
The material financial assumptions used for estimating the benefit obligations of the plans are set out below. The assumptions are reviewed by
management at the end of each year, and are used to evaluate accrued pension and other post-retirement benefits at 31 December and pension
expense for the following year.
The parent company financial statements of BP p.l.c. on pages 196-213 do not form part of BP’s Annual Report on Form 20-F as filed with the SEC.
Financial statements
BP Annual Report and Form 20-F 2015 201