BP 2015 Annual Report Download - page 231
Download and view the complete annual report
Please find page 231 of the 2015 BP annual report below. You can navigate through the pages in the report by either clicking on the pages listed below, or by using the keyword search tool below to find specific information within the annual report.-
 1
1 -
2
-
3
-
4
-
5
-
6
-
7
-
8
-
9
-
10
-
11
-
12
-
13
-
14
-
15
-
16
-
17
-
18
-
19
-
20
-
21
-
22
-
23
-
24
-
25
-
26
-
27
-
28
-
29
-
30
-
31
-
32
-
33
-
34
-
35
-
36
-
37
-
38
-
39
-
40
-
41
-
42
-
43
-
44
-
45
-
46
-
47
-
48
-
49
-
50
-
51
-
52
-
53
-
54
-
55
-
56
-
57
-
58
-
59
-
60
-
61
-
62
-
63
-
64
-
65
-
66
-
67
-
68
-
69
-
70
-
71
-
72
-
73
-
74
-
75
-
76
-
77
-
78
-
79
-
80
-
81
-
82
-
83
-
84
-
85
-
86
-
87
-
88
-
89
-
90
-
91
-
92
-
93
-
94
-
95
-
96
-
97
-
98
-
99
-
100
-
101
-
102
-
103
-
104
-
105
-
106
-
107
-
108
-
109
-
110
-
111
-
112
-
113
-
114
-
115
-
116
-
117
-
118
-
119
-
120
-
121
-
122
-
123
-
124
-
125
-
126
-
127
-
128
-
129
-
130
-
131
-
132
-
133
-
134
-
135
-
136
-
137
-
138
-
139
-
140
-
141
-
142
-
143
-
144
-
145
-
146
-
147
-
148
-
149
-
150
-
151
-
152
-
153
-
154
-
155
-
156
-
157
-
158
-
159
-
160
-
161
-
162
-
163
-
164
-
165
-
166
-
167
-
168
-
169
-
170
-
171
-
172
-
173
-
174
-
175
-
176
-
177
-
178
-
179
-
180
-
181
-
182
-
183
-
184
-
185
-
186
-
187
-
188
-
189
-
190
-
191
-
192
-
193
-
194
-
195
-
196
-
197
-
198
-
199
-
200
-
201
-
202
-
203
-
204
-
205
-
206
-
207
-
208
-
209
-
210
-
211
-
212
-
213
-
214
-
215
-
216
-
217
-
218
-
219
-
220
-
 221
221 -
 222
222 -
 223
223 -
 224
224 -
 225
225 -
 226
226 -
 227
227 -
 228
228 -
 229
229 -
 230
230 -
 231
231 -
 232
232 -
 233
233 -
 234
234 -
 235
235 -
 236
236 -
 237
237 -
 238
238 -
 239
239 -
 240
240 -
 241
241 -
242
-
243
-
244
-
245
-
246
-
247
-
248
-
249
-
250
-
251
-
252
-
253
-
254
-
255
-
256
-
257
-
258
-
259
-
260
-
261
-
262
-
263
-
264
-
265
-
266
 |
 |

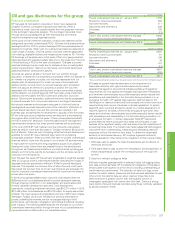
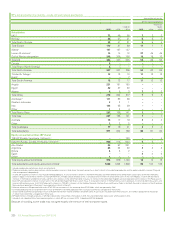
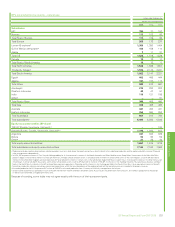
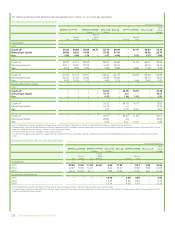
Oil and gas disclosures for the group
Resource progression
BP manages its hydrocarbon resources in three major categories:
prospect inventory, contingent resources and reserves. When a
discovery is made, volumes usually transfer from the prospect inventory
to the contingent resources category. The contingent resources move
through various sub-categories as their technical and commercial
maturity increases through appraisal activity.
At the point of final investment decision, most proved reserves will be
categorized as proved undeveloped (PUD). Volumes will subsequently be
recategorized from PUD to proved developed (PD) as a consequence of
development activity. When part of a well’s proved reserves depends on
a later phase of activity, only that portion of proved reserves associated
with existing, available facilities and infrastructure moves to PD. The first
PD bookings will typically occur at the point of first oil or gas production.
Major development projects typically take one to five years from the time
of initial booking of PUD to the start of production. Changes to proved
reserves bookings may be made due to analysis of new or existing data
concerning production, reservoir performance, commercial factors and
additional reservoir development activity.
Volumes can also be added or removed from our portfolio through
acquisition or divestment of properties and projects. When we dispose of
an interest in a property or project, the volumes associated with our
adopted plan of development for which we have a final investment
decision will be removed from our proved reserves upon completion.
When we acquire an interest in a property or project, the volumes
associated with the existing development and any committed projects
will be added to our proved reserves if BP has made a final investment
decision and they satisfy the SEC’s criteria for attribution of proved
status. Following the acquisition, additional volumes may be progressed
to proved reserves from non-proved reserves or contingent resources.
Non-proved reserves and contingent resources in a field will only be
recategorized as proved reserves when all the criteria for attribution of
proved status have been met and the volumes are included in the
business plan and scheduled for development, typically within five years.
BP will only book proved reserves where development is scheduled to
commence after more than five years, if these proved reserves satisfy
the SEC’s criteria for attribution of proved status and BP management
has reasonable certainty that these proved reserves will be produced.
At the end of 2015 BP had material volumes of proved undeveloped
reserves held for more than five years in Trinidad, the North Sea and the
Gulf of Mexico. These are part of ongoing infrastructure-led development
activities for which BP has a historical track record of completing
comparable projects in these countries. We have no proved undeveloped
reserves held for more than five years in our onshore US developments.
In each case the volumes are being progressed as part of an adopted
development plan where there are physical limits to the development
timing such as infrastructure limitations, contractual limits including gas
delivery commitments, late life compression and the complex nature of
working in remote locations.
Over the past five years, BP has annually progressed a weighted average
18% of our group proved undeveloped reserves (including the impact of
disposals and price acceleration effects in PSAs) to proved developed
reserves. This equates to a turnover time of about five and a half years.
We expect the turnover time to remain near this level and anticipate the
volume of proved undeveloped reserves held for more than five years to
remain about the same.
In 2015 we progressed 959mmboe of proved undeveloped reserves
(626mmboe for our subsidiaries alone) to proved developed reserves
through ongoing investment in our subsidiaries’ and equity-accounted
entities’ upstream development activities. Total development
expenditure, excluding midstream activities, was $16,731 million in 2015
($13,458 million for subsidiaries and $3,273 million for equity-accounted
entities). The major areas with progressed volumes in 2015 were Angola,
Azerbaijan, Russia, UK and US. Revisions of previous estimates for
proved undeveloped reserves are due to changes relating to field
performance, well results or changes in commercial conditions including
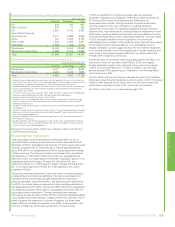
price impacts. The following tables describe the changes to our proved
undeveloped reserves position through the year for our subsidiaries and
equity-accounted entities and for our subsidiaries alone.
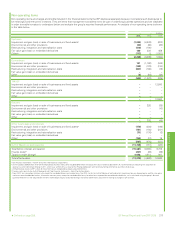
Subsidiaries and equity-accounted entities volumes in mmboea
Proved undeveloped reserves at 1 January 2015 7,788
Revisions of previous estimates 300
Improved recovery 111
Discoveries and extensions 339
Purchases 126
Sales (17)
Total in year proved undeveloped reserves changes 8,646
Progressed to proved developed reserves (959)
Proved undeveloped reserves at 31 December 2015 7,687
Subsidiaries only volumes in mmboea
Proved undeveloped reserves at 1 January 2015 4,507
Revisions of previous estimates 61
Improved recovery 106
Discoveries and extensions 79
Purchases 101
Sales (17)
Total in year proved undeveloped reserves changes 4,837
Progressed to proved developed reserves (626)
Proved undeveloped reserves at 31 December 2015 4,211
aBecause of rounding, some totals may not agree exactly with the sum of their component parts.
BP bases its proved reserves estimates on the requirement of
reasonable certainty with rigorous technical and commercial
assessments based on conventional industry practice and regulatory
requirements. BP only applies technologies that have been field tested
and have been demonstrated to provide reasonably certain results with
consistency and repeatability in the formation being evaluated or in an
analogous formation. BP applies high-resolution seismic data for the
identification of reservoir extent and fluid contacts only where there is an
overwhelming track record of success in its local application. In certain
cases BP uses numerical simulation as part of a holistic assessment of
recovery factor for its fields, where these simulations have been field
tested and have been demonstrated to provide reasonably certain results
with consistency and repeatability in the formation being evaluated or in
an analogous formation. In certain deepwater fields BP has booked
proved reserves before production flow tests are conducted, in part
because of the significant safety, cost and environmental implications of
conducting these tests. The industry has made substantial technological
improvements in understanding, measuring and delineating reservoir
properties without the need for flow tests. To determine reasonable
certainty of commercial recovery, BP employs a general method of
reserves assessment that relies on the integration of three types of data:
1. Well data used to assess the local characteristics and conditions of
reservoirs and fluids.
2. Field scale seismic data to allow the interpolation and extrapolation of
these characteristics outside the immediate area of the local well
control.
3. Data from relevant analogous fields.
Well data includes appraisal wells or sidetrack holes, full logging suites,
core data and fluid samples. BP considers the integration of this data in
certain cases to be superior to a flow test in providing understanding of
overall reservoir performance. The collection of data from logs, cores,
wireline formation testers, pressures and fluid samples calibrated to each
other and to the seismic data can allow reservoir properties to be
determined over a greater volume than the localized volume of
investigation associated with a short-term flow test. There is a strong
track record of proved reserves recorded using these methods, validated
by actual production levels.
Additional disclosures
BP Annual Report and Form 20-F 2015 227