BP 2015 Annual Report Download - page 170
Download and view the complete annual report
Please find page 170 of the 2015 BP annual report below. You can navigate through the pages in the report by either clicking on the pages listed below, or by using the keyword search tool below to find specific information within the annual report.-
 1
1 -
2
-
3
-
4
-
5
-
6
-
7
-
8
-
9
-
10
-
11
-
12
-
13
-
14
-
15
-
16
-
17
-
18
-
19
-
20
-
21
-
22
-
23
-
24
-
25
-
26
-
27
-
28
-
29
-
30
-
31
-
32
-
33
-
34
-
35
-
36
-
37
-
38
-
39
-
40
-
41
-
42
-
43
-
44
-
45
-
46
-
47
-
48
-
49
-
50
-
51
-
52
-
53
-
54
-
55
-
56
-
57
-
58
-
59
-
60
-
61
-
62
-
63
-
64
-
65
-
66
-
67
-
68
-
69
-
70
-
71
-
72
-
73
-
74
-
75
-
76
-
77
-
78
-
79
-
80
-
81
-
82
-
83
-
84
-
85
-
86
-
87
-
88
-
89
-
90
-
91
-
92
-
93
-
94
-
95
-
96
-
97
-
98
-
99
-
100
-
101
-
102
-
103
-
104
-
105
-
106
-
107
-
108
-
109
-
110
-
111
-
112
-
113
-
114
-
115
-
116
-
117
-
118
-
119
-
120
-
121
-
122
-
123
-
124
-
125
-
126
-
127
-
128
-
129
-
130
-
131
-
132
-
133
-
134
-
135
-
136
-
137
-
138
-
139
-
140
-
141
-
142
-
143
-
144
-
145
-
146
-
147
-
148
-
149
-
150
-
151
-
152
-
153
-
154
-
155
-
156
-
157
-
158
-
159
-
 160
160 -
 161
161 -
 162
162 -
 163
163 -
 164
164 -
 165
165 -
 166
166 -
 167
167 -
 168
168 -
 169
169 -
 170
170 -
 171
171 -
 172
172 -
 173
173 -
 174
174 -
 175
175 -
 176
176 -
 177
177 -
 178
178 -
 179
179 -
 180
180 -
181
-
182
-
183
-
184
-
185
-
186
-
187
-
188
-
189
-
190
-
191
-
192
-
193
-
194
-
195
-
196
-
197
-
198
-
199
-
200
-
201
-
202
-
203
-
204
-
205
-
206
-
207
-
208
-
209
-
210
-
211
-
212
-
213
-
214
-
215
-
216
-
217
-
218
-
219
-
220
-
221
-
222
-
223
-
224
-
225
-
226
-
227
-
228
-
229
-
230
-
231
-
232
-
233
-
234
-
235
-
236
-
237
-
238
-
239
-
240
-
241
-
242
-
243
-
244
-
245
-
246
-
247
-
248
-
249
-
250
-
251
-
252
-
253
-
254
-
255
-
256
-
257
-
258
-
259
-
260
-
261
-
262
-
263
-
264
-
265
-
266
 |
 |

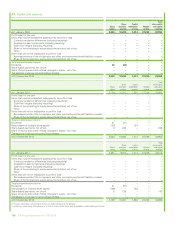
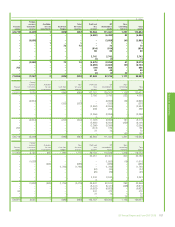
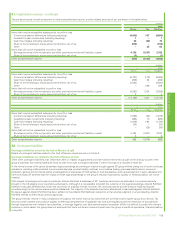
37. Condensed consolidating information on certain US subsidiaries – continued
Balance sheet
$ million
At 31 December 2015
Issuer Guarantor
BP
Exploration
(Alaska) Inc. BP p.l.c.
Other
subsidiaries
Eliminations and
reclassifications BP group
Non-current assets
Property, plant and equipment 8,306 – 121,452 – 129,758
Goodwill – – 11,627 – 11,627
Intangible assets 539 – 18,121 – 18,660
Investments in joint ventures – – 8,412 – 8,412
Investments in associates – 2 9,420 – 9,422
Other investments – – 1,002 – 1,002
Subsidiaries – equity-accounted basis – 128,234 – (128,234) –
Fixed assets 8,845 128,236 170,034 (128,234) 178,881
Loans 3 – 7,245 (6,719) 529
Trade and other receivables – – 2,216 – 2,216
Derivative financial instruments – – 4,409 – 4,409
Prepayments 4 – 999 – 1,003
Deferred tax assets – – 1,545 – 1,545
Defined benefit pension plan surpluses – 2,516 131 – 2,647
8,852 130,752 186,579 (134,953) 191,230
Current assets
Loans – – 272 – 272
Inventories 246 – 13,896 – 14,142
Trade and other receivables 9,718 1,062 22,393 (10,850) 22,323
Derivative financial instruments – – 4,242 – 4,242
Prepayments 7 – 1,831 – 1,838
Current tax receivable – – 599 – 599
Other investments – – 219 – 219
Cash and cash equivalents – – 26,389 – 26,389
9,971 1,062 69,841 (10,850) 70,024
Assets classified as held for sale – – 578 – 578
9,971 1,062 70,419 (10,850) 70,602
Total assets 18,823 131,814 256,998 (145,803) 261,832
Current liabilities
Trade and other payables 961 127 41,711 (10,850) 31,949
Derivative financial instruments – – 3,239 – 3,239
Accruals 116 81 6,064 – 6,261
Finance debt – – 6,944 – 6,944
Current tax payable (21) 4 1,097 – 1,080
Provisions 1 – 5,153 – 5,154
1,057 212 64,208 (10,850) 54,627
Liabilities directly associated with assets classified as held for sale – – 97 – 97
1,057 212 64,305 (10,850) 54,724
Non-current liabilities
Other payables 8 6,708 2,913 (6,719) 2,910
Derivative financial instruments – – 4,283 – 4,283
Accruals – 33 857 – 890
Finance debt – – 46,224 – 46,224
Deferred tax liabilities 1,238 877 7,484 – 9,599
Provisions 2,326 – 33,634 – 35,960
Defined benefit pension plan and other post-retirement benefit plan
deficits – 227 8,628 – 8,855
3,572 7,845 104,023 (6,719) 108,721
Total liabilities 4,629 8,057 168,328 (17,569) 163,445
Net assets 14,194 123,757 88,670 (128,234) 98,387
Equity
BP shareholders’ equity 14,194 123,757 87,499 (128,234) 97,216
Non-controlling interests – – 1,171 – 1,171
14,194 123,757 88,670 (128,234) 98,387
166 BP Annual Report and Form 20-F 2015