BP 2015 Annual Report Download - page 158
Download and view the complete annual report
Please find page 158 of the 2015 BP annual report below. You can navigate through the pages in the report by either clicking on the pages listed below, or by using the keyword search tool below to find specific information within the annual report.-
 1
1 -
2
-
3
-
4
-
5
-
6
-
7
-
8
-
9
-
10
-
11
-
12
-
13
-
14
-
15
-
16
-
17
-
18
-
19
-
20
-
21
-
22
-
23
-
24
-
25
-
26
-
27
-
28
-
29
-
30
-
31
-
32
-
33
-
34
-
35
-
36
-
37
-
38
-
39
-
40
-
41
-
42
-
43
-
44
-
45
-
46
-
47
-
48
-
49
-
50
-
51
-
52
-
53
-
54
-
55
-
56
-
57
-
58
-
59
-
60
-
61
-
62
-
63
-
64
-
65
-
66
-
67
-
68
-
69
-
70
-
71
-
72
-
73
-
74
-
75
-
76
-
77
-
78
-
79
-
80
-
81
-
82
-
83
-
84
-
85
-
86
-
87
-
88
-
89
-
90
-
91
-
92
-
93
-
94
-
95
-
96
-
97
-
98
-
99
-
100
-
101
-
102
-
103
-
104
-
105
-
106
-
107
-
108
-
109
-
110
-
111
-
112
-
113
-
114
-
115
-
116
-
117
-
118
-
119
-
120
-
121
-
122
-
123
-
124
-
125
-
126
-
127
-
128
-
129
-
130
-
131
-
132
-
133
-
134
-
135
-
136
-
137
-
138
-
139
-
140
-
141
-
142
-
143
-
144
-
145
-
146
-
147
-
 148
148 -
 149
149 -
 150
150 -
 151
151 -
 152
152 -
 153
153 -
 154
154 -
 155
155 -
 156
156 -
 157
157 -
 158
158 -
 159
159 -
 160
160 -
 161
161 -
 162
162 -
 163
163 -
 164
164 -
 165
165 -
 166
166 -
 167
167 -
 168
168 -
169
-
170
-
171
-
172
-
173
-
174
-
175
-
176
-
177
-
178
-
179
-
180
-
181
-
182
-
183
-
184
-
185
-
186
-
187
-
188
-
189
-
190
-
191
-
192
-
193
-
194
-
195
-
196
-
197
-
198
-
199
-
200
-
201
-
202
-
203
-
204
-
205
-
206
-
207
-
208
-
209
-
210
-
211
-
212
-
213
-
214
-
215
-
216
-
217
-
218
-
219
-
220
-
221
-
222
-
223
-
224
-
225
-
226
-
227
-
228
-
229
-
230
-
231
-
232
-
233
-
234
-
235
-
236
-
237
-
238
-
239
-
240
-
241
-
242
-
243
-
244
-
245
-
246
-
247
-
248
-
249
-
250
-
251
-
252
-
253
-
254
-
255
-
256
-
257
-
258
-
259
-
260
-
261
-
262
-
263
-
264
-
265
-
266
 |
 |

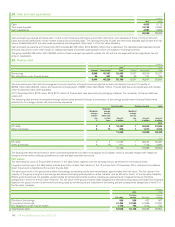
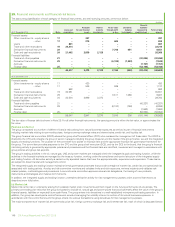
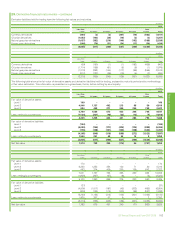
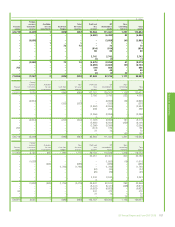
29. Derivative financial instruments – continued
Level 3 derivatives
The following table shows the changes during the year in the net fair value of derivatives held for trading purposes within level 3 of the fair value
hierarchy.
$ million
Oil
price
Natural gas
price
Power
price Other Total
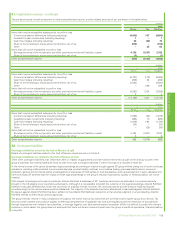
Net fair value of contracts at 1 January 2015 246 181 214 389 1,030
Gains (losses) recognized in the income statement (24) 272 79 92 419
Inception fair value of new contracts 126 14 87 – 227
Settlements (20) (40) (72) (189) (321)
Transfers out of level 3 – (107) (23) – (130)
Net fair value of contracts at 31 December 2015 328 320 285 292 1,225
$ million
Oil
price
Natural gas
price
Power
price Other Total
Net fair value of contracts at 1 January 2014 (18) 313 86 475 856
Gains recognized in the income statement 270 133 79 94 576
Inception fair value of new contracts 80 19 62 – 161
Settlements (86) (56) (13) (180) (335)
Transfers out of level 3 – (228) – – (228)
Net fair value of contracts at 31 December 2014 246 181 214 389 1,030
The amount recognized in the income statement for the year relating to level 3 held-for-trading derivatives still held at 31 December 2015 was a
$293 million gain (2014 $456 million gain related to derivatives still held at 31 December 2014).
Derivative gains and losses
Gains and losses relating to derivative contracts are included within sales and other operating revenues and within purchases in the income statement
depending upon the nature of the activity and type of contract involved. The contract types treated in this way include futures, options, swaps and
certain forward sales and forward purchases contracts, and relate to both currency and commodity trading activities. Gains or losses arise on contracts
entered into for risk management purposes, optimization activity and entrepreneurial trading. They also arise on certain contracts that are for normal
procurement or sales activity for the group but that are required to be fair valued under accounting standards. Also included within sales and other
operating revenues are gains and losses on inventory held for trading purposes. The total amount relating to all these items (excluding gains and losses
on realized physical derivative contracts that have been reflected gross in the income statement within sales and purchases) was a net gain of
$5,508 million (2014 $6,154 million net gain and 2013 $587 million net gain). This number does not include gains and losses on realized physical
derivative contracts that have been reflected gross in the income statement within sales and purchases or the change in value of transportation and
storage contracts which are not recognized under IFRS, but does include the associated financially settled contracts. The net amount for actual gains
and losses relating to derivative contracts and all related items therefore differs significantly from the amount disclosed above.
Embedded derivatives
The group has embedded derivatives relating to certain natural gas contracts. The fair value gain on commodity price embedded derivatives included
within distribution and administration expenses was $120 million (2014 gain of $430 million, 2013 gain of $459 million).
Cash flow hedges
At 31 December 2015, the group held currency forwards, futures contracts and cylinders and cross-currency interest rate swaps that were being used
to hedge the foreign currency risk of highly probable forecast transactions and floating rate finance debt. Note 28 outlines the group’s approach to
foreign currency exchange risk management. For cash flow hedges the group only claims hedge accounting for the intrinsic value on the currency with
any fair value attributable to time value taken immediately to the income statement. The amounts remaining in equity at 31 December 2015 in relation
to these cash flow hedges consist of deferred losses of $55 million maturing in 2016, deferred losses of $15 million maturing in 2017 and deferred
losses of $3 million maturing in 2018 and beyond.
Two of the contracts to acquire an 18.5% interest in Rosneft, which completed in March 2013, were designated as hedging instruments in a cash flow
hedge. A cumulative charge of $651 million has been recognized in other comprehensive income, of which a charge of $2,061 million arose in 2013.
This loss will only be reclassified to the income statement if the investment in Rosneft is either sold or impaired.
Fair value hedges
At 31 December 2015, the group held interest rate and cross-currency interest rate swap contracts as fair value hedges of the interest rate risk on fixed
rate debt issued by the group. The loss on the hedging derivative instruments recognized in the income statement in 2015 was $788 million (2014
$14 million loss and 2013 $1,240 million loss) offset by a gain on the fair value of the finance debt of $833 million (2014 $8 million gain and 2013
$1,228 million gain).
The interest rate and cross-currency interest rate swaps mature within one to eleven years, and have the same maturity terms as the debt that they are
hedging. They are used to convert sterling, euro, Swiss franc, Australian dollar, Canadian dollar, Norwegian Krone and Hong Kong dollar denominated
fixed rate borrowings into floating rate debt. Note 28 outlines the group’s approach to interest rate and foreign currency exchange risk management.
154 BP Annual Report and Form 20-F 2015