BP 2015 Annual Report Download - page 140
Download and view the complete annual report
Please find page 140 of the 2015 BP annual report below. You can navigate through the pages in the report by either clicking on the pages listed below, or by using the keyword search tool below to find specific information within the annual report.-
 1
1 -
2
-
3
-
4
-
5
-
6
-
7
-
8
-
9
-
10
-
11
-
12
-
13
-
14
-
15
-
16
-
17
-
18
-
19
-
20
-
21
-
22
-
23
-
24
-
25
-
26
-
27
-
28
-
29
-
30
-
31
-
32
-
33
-
34
-
35
-
36
-
37
-
38
-
39
-
40
-
41
-
42
-
43
-
44
-
45
-
46
-
47
-
48
-
49
-
50
-
51
-
52
-
53
-
54
-
55
-
56
-
57
-
58
-
59
-
60
-
61
-
62
-
63
-
64
-
65
-
66
-
67
-
68
-
69
-
70
-
71
-
72
-
73
-
74
-
75
-
76
-
77
-
78
-
79
-
80
-
81
-
82
-
83
-
84
-
85
-
86
-
87
-
88
-
89
-
90
-
91
-
92
-
93
-
94
-
95
-
96
-
97
-
98
-
99
-
100
-
101
-
102
-
103
-
104
-
105
-
106
-
107
-
108
-
109
-
110
-
111
-
112
-
113
-
114
-
115
-
116
-
117
-
118
-
119
-
120
-
121
-
122
-
123
-
124
-
125
-
126
-
127
-
128
-
129
-
 130
130 -
 131
131 -
 132
132 -
 133
133 -
 134
134 -
 135
135 -
 136
136 -
 137
137 -
 138
138 -
 139
139 -
 140
140 -
 141
141 -
 142
142 -
 143
143 -
 144
144 -
 145
145 -
 146
146 -
 147
147 -
 148
148 -
 149
149 -
 150
150 -
151
-
152
-
153
-
154
-
155
-
156
-
157
-
158
-
159
-
160
-
161
-
162
-
163
-
164
-
165
-
166
-
167
-
168
-
169
-
170
-
171
-
172
-
173
-
174
-
175
-
176
-
177
-
178
-
179
-
180
-
181
-
182
-
183
-
184
-
185
-
186
-
187
-
188
-
189
-
190
-
191
-
192
-
193
-
194
-
195
-
196
-
197
-
198
-
199
-
200
-
201
-
202
-
203
-
204
-
205
-
206
-
207
-
208
-
209
-
210
-
211
-
212
-
213
-
214
-
215
-
216
-
217
-
218
-
219
-
220
-
221
-
222
-
223
-
224
-
225
-
226
-
227
-
228
-
229
-
230
-
231
-
232
-
233
-
234
-
235
-
236
-
237
-
238
-
239
-
240
-
241
-
242
-
243
-
244
-
245
-
246
-
247
-
248
-
249
-
250
-
251
-
252
-
253
-
254
-
255
-
256
-
257
-
258
-
259
-
260
-
261
-
262
-
263
-
264
-
265
-
266
 |
 |

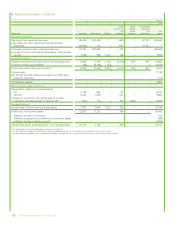
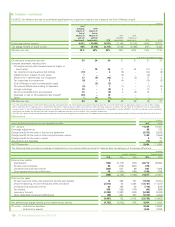
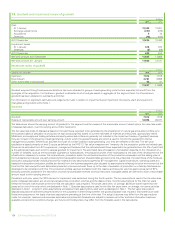
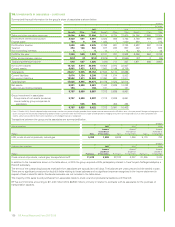
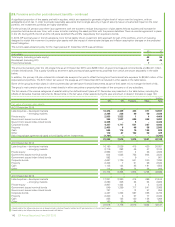
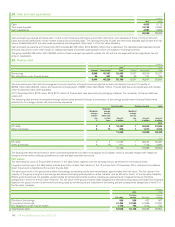
15. Investments in joint ventures
The following table provides aggregated summarized financial information relating to the group’s share of joint ventures.
$ million
2015 2014 2013
Sales and other operating revenues 9,588 12,208 12,507
Profit before interest and taxation 785 1,210 1,076
Finance costs 188 125 130
Profit before taxation 597 1,085 946
Taxation 625 515 499
Profit (loss) for the year (28) 570 447
Other comprehensive income (1) (15) 38
Total comprehensive income (29) 555 485
Non-current assets 11,163 11,586
Current assets 2,515 2,853
Total assets 13,678 14,439
Current liabilities 1,855 2,222
Non-current liabilities 3,500 3,774
Total liabilities 5,355 5,996
Net assets 8,323 8,443
Group investment in joint ventures
Group share of net assets (as above) 8,323 8,443
Loans made by group companies to joint ventures 89 310
8,412 8,753
The loss for the year shown in the table above includes $711 million relating to BP’s share of impairment losses recognized by joint ventures, a
significant element of which relates to the Angola LNG plant.
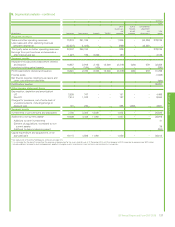
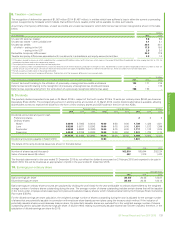
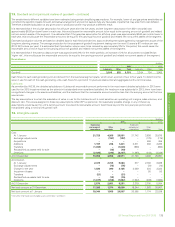
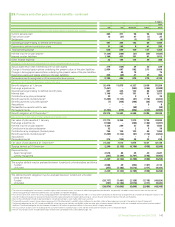
Transactions between the group and its joint ventures are summarized below.
$ million
Sales to joint ventures 2015 2014 2013
Product Sales
Amount
receivable at
31 December Sales
Amount
receivable at
31 December Sales
Amount
receivable at
31 December
LNG, crude oil and oil products, natural gas 2,841 245 3,148 300 4,125 342
$ million
Purchases from joint ventures 2015 2014 2013
Product Purchases
Amount
payable at
31 December Purchases
Amount
payable at
31 December Purchases
Amount
payable at
31 December
LNG, crude oil and oil products, natural gas, refinery operating
costs, plant processing fees 861 104 907 129 503 51
The terms of the outstanding balances receivable from joint ventures are typically 30 to 45 days. The balances are unsecured and will be settled in
cash. There are no significant provisions for doubtful debts relating to these balances and no significant expense recognized in the income statement
in respect of bad or doubtful debts. Dividends receivable are not included in the table above.
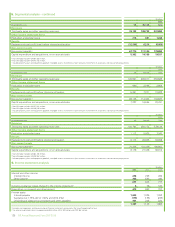
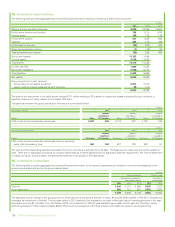
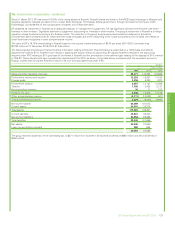
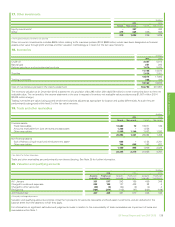
16. Investments in associates
The following table provides aggregated summarized financial information for the group’s associates as it relates to the amounts recognized in the
group income statement and on the group balance sheet.
$ million
Income statement Balance sheet
Earnings from associates –
after interest and tax
Investments
in associates
2015 2014 2013 2015 2014
Rosneft 1,330 2,101 2,058 5,797 7,312
Other associates 509 701 684 3,625 3,091
1,839 2,802 2,742 9,422 10,403
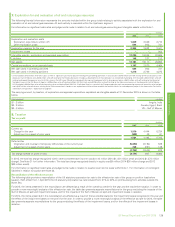
The associate that is material to the group at both 31 December 2015 and 2014 is Rosneft. In 2013, BP sold its 50% interest in TNK-BP to Rosneft and
increased its investment in Rosneft. The net cash inflow in 2013 relating to the transaction included in Net cash used in investing activities in the cash
flow statement was $11.8 billion. From 22 October 2012, the investment in TNK-BP was classified as an asset held for sale and, therefore, equity
accounting ceased. Profits of approximately $738 million were not recognized in 2013 as a result of the discontinuance of equity accounting.
136 BP Annual Report and Form 20-F 2015