BP 2015 Annual Report Download - page 12
Download and view the complete annual report
Please find page 12 of the 2015 BP annual report below. You can navigate through the pages in the report by either clicking on the pages listed below, or by using the keyword search tool below to find specific information within the annual report.-
 1
1 -
 2
2 -
 3
3 -
 4
4 -
 5
5 -
 6
6 -
 7
7 -
 8
8 -
 9
9 -
 10
10 -
 11
11 -
 12
12 -
 13
13 -
 14
14 -
 15
15 -
 16
16 -
 17
17 -
 18
18 -
 19
19 -
 20
20 -
 21
21 -
 22
22 -
23
-
24
-
25
-
26
-
27
-
28
-
29
-
30
-
31
-
32
-
33
-
34
-
35
-
36
-
37
-
38
-
39
-
40
-
41
-
42
-
43
-
44
-
45
-
46
-
47
-
48
-
49
-
50
-
51
-
52
-
53
-
54
-
55
-
56
-
57
-
58
-
59
-
60
-
61
-
62
-
63
-
64
-
65
-
66
-
67
-
68
-
69
-
70
-
71
-
72
-
73
-
74
-
75
-
76
-
77
-
78
-
79
-
80
-
81
-
82
-
83
-
84
-
85
-
86
-
87
-
88
-
89
-
90
-
91
-
92
-
93
-
94
-
95
-
96
-
97
-
98
-
99
-
100
-
101
-
102
-
103
-
104
-
105
-
106
-
107
-
108
-
109
-
110
-
111
-
112
-
113
-
114
-
115
-
116
-
117
-
118
-
119
-
120
-
121
-
122
-
123
-
124
-
125
-
126
-
127
-
128
-
129
-
130
-
131
-
132
-
133
-
134
-
135
-
136
-
137
-
138
-
139
-
140
-
141
-
142
-
143
-
144
-
145
-
146
-
147
-
148
-
149
-
150
-
151
-
152
-
153
-
154
-
155
-
156
-
157
-
158
-
159
-
160
-
161
-
162
-
163
-
164
-
165
-
166
-
167
-
168
-
169
-
170
-
171
-
172
-
173
-
174
-
175
-
176
-
177
-
178
-
179
-
180
-
181
-
182
-
183
-
184
-
185
-
186
-
187
-
188
-
189
-
190
-
191
-
192
-
193
-
194
-
195
-
196
-
197
-
198
-
199
-
200
-
201
-
202
-
203
-
204
-
205
-
206
-
207
-
208
-
209
-
210
-
211
-
212
-
213
-
214
-
215
-
216
-
217
-
218
-
219
-
220
-
221
-
222
-
223
-
224
-
225
-
226
-
227
-
228
-
229
-
230
-
231
-
232
-
233
-
234
-
235
-
236
-
237
-
238
-
239
-
240
-
241
-
242
-
243
-
244
-
245
-
246
-
247
-
248
-
249
-
250
-
251
-
252
-
253
-
254
-
255
-
256
-
257
-
258
-
259
-
260
-
261
-
262
-
263
-
264
-
265
-
266
 |
 |

Group chief executive’s letter
Dear fellow shareholder,
In 2015 we continued to adapt to the tough environment created by the dramatic drop in oil
prices. We have seen prices crash before, but this fall has been particularly steep, from
over $100 a barrel in mid-2014 to below $30 by January 2016. The work we have done to
reshape and strengthen BP after 2010 stood us in good stead to withstand these
conditions and last year we took further action to make the business more resilient in the
short term. We also continue to invest for long-term growth. Our safety record improved,
along with operating reliability, while costs came down and capital discipline was
maintained. The current environment has however impacted our financial results, as well
as those of our competitors. So, while the oil price is beyond our control, we have
performed strongly on the factors that we can control.
A safer, more reliable, more resilient BP
In terms of safety, our top priority, we achieved improvements year-on-year in all of our key
safety measures – process safety events, leaks, spills and other releases, and recordable
injuries. This performance is at a much better level than five years ago and in line with the
best among our peers. Safety is also good business. When we operate safely, our
operations are more reliable. When the assets run reliably, they operate more continuously.
When our operations run efficiently, we have better financial results.
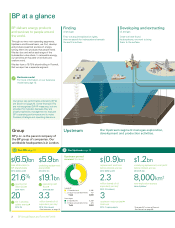
In the current business environment, competitiveness depends on minimizing our costs
and being disciplined in our use of limited capital – as demonstrated by our organic capital
expenditure in 2015 of $18.7 billion, down from nearly $23 billion in 2014. And we continue
to focus our portfolio on the highest quality projects and operations, divesting $10 billion
worth of assets in 2014 and 2015, in line with our target.
2015 was a challenging year for our Upstream business, with weaker oil and gas
realizations leading to a significantly lower underlying pre-tax replacement cost profit of
$1.2 billion. However, efficiency and reliability improved across the business in 2015.
Upstream unit production costs were down 20% on 2013, and BP-operated plant reliability
increased to 95% from 86% in 2011. We have made our base production more resilient by
improving our reservoir management and increasing efficiencies in our drilling and
operations – lowering the decline rate and reducing non-productive time in drilling to its
lowest level since 2011. And the decision to manage our US Lower 48 business separately
is starting to deliver improvements in performance and competitiveness.
Our Downstream business had a record year, delivering $7.5 billion of underlying pre-tax
replacement cost profit, demonstrating the benefit of being an integrated business. Our
refining business is ranked among the top performers based on net cash margin in the
most recent industry benchmark. We made improvements in safety, efficiency and
operational performance, and continued to develop a portfolio of highly competitive assets
and products. These include the launch in Spain of a new range of fuels with engine-
cleaning and fuel-economy benefits, the unveiling of Nexcel from Castrol – a technology
with the potential to revolutionize the oil changing process in vehicles, and the start-up of
Zhuhai 3 in China – one of the most efficient purified terephthalic acid production units in
the world.
94.7%
2015 refining availability
95%
Upstream BP-operated plant reliability
By focusing on our distinctive
areas of strength, BP has
become an increasingly agile
business, able to respond
quickly to changing conditions.
Bob Dudley
BP Annual Report and Form 20-F 20158