BP 2015 Annual Report Download - page 33
Download and view the complete annual report
Please find page 33 of the 2015 BP annual report below. You can navigate through the pages in the report by either clicking on the pages listed below, or by using the keyword search tool below to find specific information within the annual report.-
 1
1 -
2
-
3
-
4
-
5
-
6
-
7
-
8
-
9
-
10
-
11
-
12
-
13
-
14
-
15
-
16
-
17
-
18
-
19
-
20
-
21
-
22
-
 23
23 -
 24
24 -
 25
25 -
 26
26 -
 27
27 -
 28
28 -
 29
29 -
 30
30 -
 31
31 -
 32
32 -
 33
33 -
 34
34 -
 35
35 -
 36
36 -
 37
37 -
 38
38 -
 39
39 -
 40
40 -
 41
41 -
 42
42 -
 43
43 -
44
-
45
-
46
-
47
-
48
-
49
-
50
-
51
-
52
-
53
-
54
-
55
-
56
-
57
-
58
-
59
-
60
-
61
-
62
-
63
-
64
-
65
-
66
-
67
-
68
-
69
-
70
-
71
-
72
-
73
-
74
-
75
-
76
-
77
-
78
-
79
-
80
-
81
-
82
-
83
-
84
-
85
-
86
-
87
-
88
-
89
-
90
-
91
-
92
-
93
-
94
-
95
-
96
-
97
-
98
-
99
-
100
-
101
-
102
-
103
-
104
-
105
-
106
-
107
-
108
-
109
-
110
-
111
-
112
-
113
-
114
-
115
-
116
-
117
-
118
-
119
-
120
-
121
-
122
-
123
-
124
-
125
-
126
-
127
-
128
-
129
-
130
-
131
-
132
-
133
-
134
-
135
-
136
-
137
-
138
-
139
-
140
-
141
-
142
-
143
-
144
-
145
-
146
-
147
-
148
-
149
-
150
-
151
-
152
-
153
-
154
-
155
-
156
-
157
-
158
-
159
-
160
-
161
-
162
-
163
-
164
-
165
-
166
-
167
-
168
-
169
-
170
-
171
-
172
-
173
-
174
-
175
-
176
-
177
-
178
-
179
-
180
-
181
-
182
-
183
-
184
-
185
-
186
-
187
-
188
-
189
-
190
-
191
-
192
-
193
-
194
-
195
-
196
-
197
-
198
-
199
-
200
-
201
-
202
-
203
-
204
-
205
-
206
-
207
-
208
-
209
-
210
-
211
-
212
-
213
-
214
-
215
-
216
-
217
-
218
-
219
-
220
-
221
-
222
-
223
-
224
-
225
-
226
-
227
-
228
-
229
-
230
-
231
-
232
-
233
-
234
-
235
-
236
-
237
-
238
-
239
-
240
-
241
-
242
-
243
-
244
-
245
-
246
-
247
-
248
-
249
-
250
-
251
-
252
-
253
-
254
-
255
-
256
-
257
-
258
-
259
-
260
-
261
-
262
-
263
-
264
-
265
-
266
 |
 |

★ Defined on page 256.
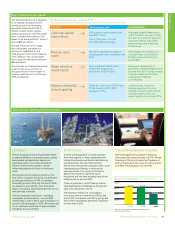
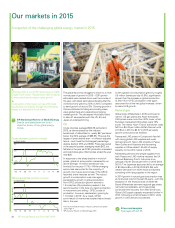
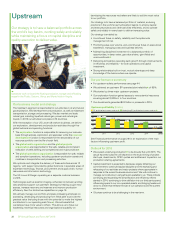
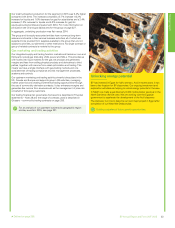
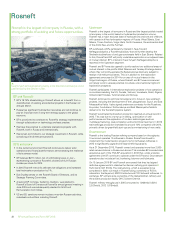
Adapting rapidly
To enable us to respond rapidly to the unique and highly competitive operating environment of the
US onshore exploration and production industry, the Lower 48 began operating as a separate
BP-operated onshore business in the US in 2015.
With its own governance, processes and systems, Lower 48 is better equipped to operate
competitively across several basins from the onshore Gulf Coast north to the Rocky Mountains,
and develop the vast resource within these large acreage positions.
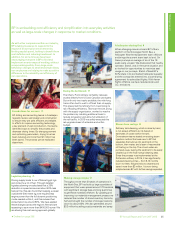
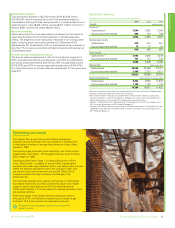
In the San Juan basin of Colorado and New Mexico, we are drawing on our deep understanding of
the area’s reservoirs and utilizing innovative well designs to significantly improve capital efficiency
and increase the number of economic development opportunities.
In 2015 we successfully completed three multi-lateral wells in the San Juan basin, our first-ever
wells of this type there. With multiple horizontal laterals from the main wellbore, instead of only
one, we can access more of the reservoir and produce significantly more resource. Our multi-
lateral wells are already among the most productive we have ever drilled in the basin, with an
average development cost that is about 60% lower than wells we drilled in the basin just a few
years ago.
We now plan for the majority of our new wells in the San Juan basin to be multi-laterals, and are
pursuing well design improvements like these across our extensive resource base.
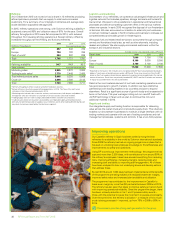
In addition to enhancing returns on new capital investments, Lower 48 is working to improve
operating efficiency through various initiatives to reduce production deferments and lower costs.
These efforts have begun to reduce production costs, which were down by about 7% year-over-
year in 2015 and are expected to decline even further in 2016.
Using experience to enhance our competitiveness.
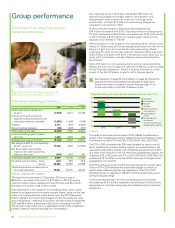
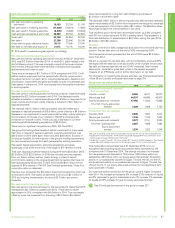
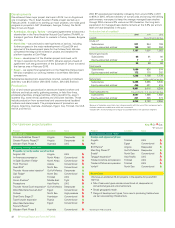
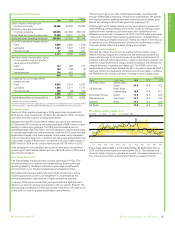
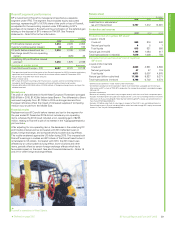
Financial performance
$ million
2015 2014 2013
Sales and other operating revenuesa 43,235 65,424 70,374
RC profit before interest and tax (937)8,934 16,657
Net (favourable) unfavourable impact
of non-operating items★ and fair
value accounting effects★2,130 6,267 1,608
Underlying RC profit before interest
and tax 1,193 15,201 18,265
Capital expenditure and acquisitions 17,082 19,772 19,115
BP average realizations★b $ per barrel
Crude oilc47.78 93.65 105.38
Natural gas liquids 20.75 36.15 38.38
Liquids★45.63 87.96 99.24
$ per thousand cubic feet
Natural gas 3.80 5.70 5.35
US natural gas 2.10 3.80 3.07
$ per barrel of oil equivalent
Total hydrocarbons★34.78 60.85 63.58
Average oil marker pricesd $ per barrel
Brent★52.39 98.95 108.66
West Texas Intermediate 48.71 93.28 97.99
Average natural gas marker prices $ per million British thermal units
Henry Hub gas price★
e 2.67 4.43 3.65
pence per therm
UK National Balancing Point gas
price★
d42.61 50.01 67.99
a
Includes sales to other segments.
b
Realizations are based on sales by consolidated subsidiaries only, which excludes
equity-accounted entities.
c
Includes condensate and bitumen.
d
All traded days average.
e
Henry Hub First of Month Index.
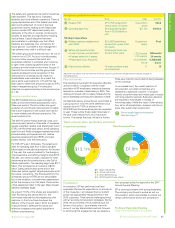
Market prices
Brent remains an integral marker to the production portfolio, from which a
significant proportion of production is priced directly or indirectly. Certain
regions use other local markers that are derived using differentials or a
lagged impact from the Brent crude oil price.
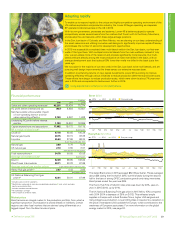
The dated Brent price in 2015 averaged $52.39 per barrel. Prices averaged
about $58 during the first half of 2015, but fell sharply during the second
half in the face of strong OPEC production growth and rising inventories.
Brent prices ended the year near $35.
The Henry Hub First of Month Index price was down by 40%, year-on-
year, in 2015 (2014, up by 21%).
The UK National Balancing Point gas price in 2015 fell by 15% compared
with 2014 (2014 a decrease of 26% on 2013). This reflected ample
supplies in Europe with robust Russian flows, higher LNG cargoes and
rising indigenous production. Lower LNG prices in Asia led to a reduction in
the price of transacted LNG available for Europe, which contributed to the
weakness of European spot prices. For more information on the global
energy market in 2015, see page 24.
BP Annual Report and Form 20-F 2015 29
Strategic report
2014
2015
90
60
30
120
150
Jan Feb Mar Apr May Jun Jul Aug Sep Oct Nov Dec
Brent ($/bbl)
2013 Five-year range
2014
2015
6
3
9
Jan Feb Mar Apr May Jun Jul Aug Sep Oct Nov Dec
Henry Hub ($/mmBtu)
2013 Five-year range