BP 2015 Annual Report Download - page 156
Download and view the complete annual report
Please find page 156 of the 2015 BP annual report below. You can navigate through the pages in the report by either clicking on the pages listed below, or by using the keyword search tool below to find specific information within the annual report.-
 1
1 -
2
-
3
-
4
-
5
-
6
-
7
-
8
-
9
-
10
-
11
-
12
-
13
-
14
-
15
-
16
-
17
-
18
-
19
-
20
-
21
-
22
-
23
-
24
-
25
-
26
-
27
-
28
-
29
-
30
-
31
-
32
-
33
-
34
-
35
-
36
-
37
-
38
-
39
-
40
-
41
-
42
-
43
-
44
-
45
-
46
-
47
-
48
-
49
-
50
-
51
-
52
-
53
-
54
-
55
-
56
-
57
-
58
-
59
-
60
-
61
-
62
-
63
-
64
-
65
-
66
-
67
-
68
-
69
-
70
-
71
-
72
-
73
-
74
-
75
-
76
-
77
-
78
-
79
-
80
-
81
-
82
-
83
-
84
-
85
-
86
-
87
-
88
-
89
-
90
-
91
-
92
-
93
-
94
-
95
-
96
-
97
-
98
-
99
-
100
-
101
-
102
-
103
-
104
-
105
-
106
-
107
-
108
-
109
-
110
-
111
-
112
-
113
-
114
-
115
-
116
-
117
-
118
-
119
-
120
-
121
-
122
-
123
-
124
-
125
-
126
-
127
-
128
-
129
-
130
-
131
-
132
-
133
-
134
-
135
-
136
-
137
-
138
-
139
-
140
-
141
-
142
-
143
-
144
-
145
-
 146
146 -
 147
147 -
 148
148 -
 149
149 -
 150
150 -
 151
151 -
 152
152 -
 153
153 -
 154
154 -
 155
155 -
 156
156 -
 157
157 -
 158
158 -
 159
159 -
 160
160 -
 161
161 -
 162
162 -
 163
163 -
 164
164 -
 165
165 -
 166
166 -
167
-
168
-
169
-
170
-
171
-
172
-
173
-
174
-
175
-
176
-
177
-
178
-
179
-
180
-
181
-
182
-
183
-
184
-
185
-
186
-
187
-
188
-
189
-
190
-
191
-
192
-
193
-
194
-
195
-
196
-
197
-
198
-
199
-
200
-
201
-
202
-
203
-
204
-
205
-
206
-
207
-
208
-
209
-
210
-
211
-
212
-
213
-
214
-
215
-
216
-
217
-
218
-
219
-
220
-
221
-
222
-
223
-
224
-
225
-
226
-
227
-
228
-
229
-
230
-
231
-
232
-
233
-
234
-
235
-
236
-
237
-
238
-
239
-
240
-
241
-
242
-
243
-
244
-
245
-
246
-
247
-
248
-
249
-
250
-
251
-
252
-
253
-
254
-
255
-
256
-
257
-
258
-
259
-
260
-
261
-
262
-
263
-
264
-
265
-
266
 |
 |

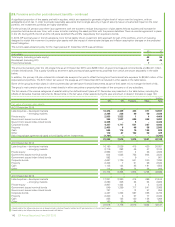
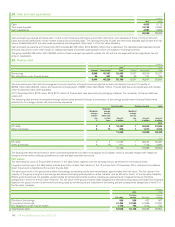
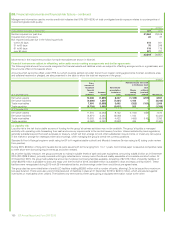
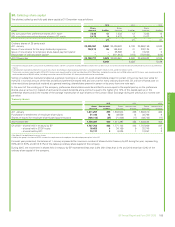
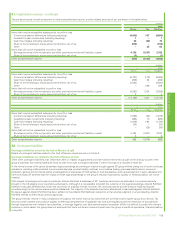
29. Derivative financial instruments – continued
Financial OTC and physical commodity options are valued using industry standard models that consider various assumptions, including quoted forward
prices for commodities, time value, volatility factors, and contractual prices for the underlying instruments, as well as other relevant economic factors.
The degree to which these inputs are observable in the forward markets determines whether the option is categorized within level 2 or level 3 of the
fair value hierarchy.
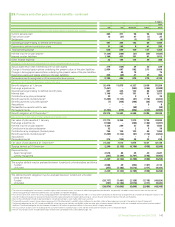
$ million
2015 2014
Fair value
asset
Fair value
liability
Fair value
asset
Fair value
liability
Derivatives held for trading
Currency derivatives 144 (1,811) 122 (902)
Oil price derivatives 2,390 (1,257) 3,133 (1,976)
Natural gas price derivatives 3,942 (2,536) 3,859 (2,518)
Power price derivatives 920 (434) 922 (404)
Other derivatives 292 – 389 –
7,688 (6,038) 8,425 (5,800)
Embedded derivatives
Commodity price contracts 12 (101) 86 (300)
12 (101) 86 (300)
Cash flow hedges
Currency forwards, futures and cylinders 9 (71) 1 (161)
Cross-currency interest rate swaps – (147) – (97)
9 (218) 1 (258)
Fair value hedges
Currency forwards, futures and swaps 33 (1,108) 78 (518)
Interest rate swaps 909 (57) 1,017 (12)
942 (1,165) 1,095 (530)
8,651 (7,522) 9,607 (6,888)
Of which – current 4,242 (3,239) 5,165 (3,689)
– non-current 4,409 (4,283) 4,442 (3,199)
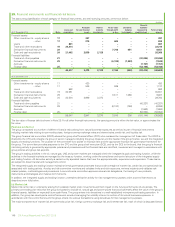
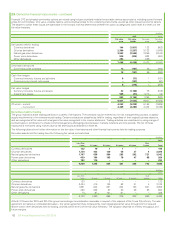
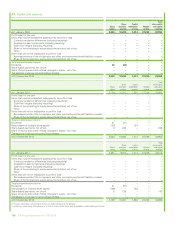
Derivatives held for trading
The group maintains active trading positions in a variety of derivatives. The contracts may be entered into for risk management purposes, to satisfy
supply requirements or for entrepreneurial trading. Certain contracts are classified as held for trading, regardless of their original business objective,
and are recognized at fair value with changes in fair value recognized in the income statement. Trading activities are undertaken by using a range of
contract types in combination to create incremental gains by arbitraging prices between markets, locations and time periods. The net of these
exposures is monitored using market value-at-risk techniques as described in Note 28.
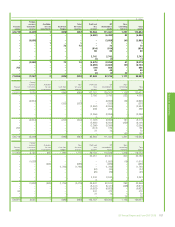
The following tables show further information on the fair value of derivatives and other financial instruments held for trading purposes.
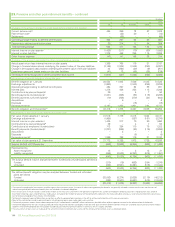
Derivative assets held for trading have the following fair values and maturities.
$ million
2015
Less than
1 year 1-2 years 2-3 years 3-4 years 4-5 years
Over
5 years Total
Currency derivatives 132 10 1 1 – – 144
Oil price derivatives 1,729 432 130 58 37 4 2,390
Natural gas price derivatives 1,707 639 390 283 202 721 3,942
Power price derivatives 459 164 103 79 47 68 920
Other derivatives 182110––––292
4,209 1,355 624 421 286 793 7,688
$ million
2014
Less than
1 year 1-2 years 2-3 years 3-4 years 4-5 years
Over
5 years Total
Currency derivatives 120 – 2 – – – 122
Oil price derivatives 2,434 416 185 63 31 4 3,133
Natural gas price derivatives 1,991 644 261 202 160 601 3,859
Power price derivatives 488 203 87 50 39 55 922
Other derivatives 70 97 161 61 – – 389
5,103 1,360 696 376 230 660 8,425
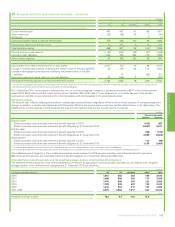
At both 31 December 2015 and 2014 the group had contingent consideration receivable in respect of the disposal of the Texas City refinery. The sale
agreement contained an embedded derivative – the whole agreement has, consequently, been designated at fair value through profit or loss and
shown within other derivatives held for trading, and falls within level 3 of the fair value hierarchy. The valuation depends on refinery throughput and
future margins.
152 BP Annual Report and Form 20-F 2015