BP 2015 Annual Report Download - page 145
Download and view the complete annual report
Please find page 145 of the 2015 BP annual report below. You can navigate through the pages in the report by either clicking on the pages listed below, or by using the keyword search tool below to find specific information within the annual report.-
 1
1 -
2
-
3
-
4
-
5
-
6
-
7
-
8
-
9
-
10
-
11
-
12
-
13
-
14
-
15
-
16
-
17
-
18
-
19
-
20
-
21
-
22
-
23
-
24
-
25
-
26
-
27
-
28
-
29
-
30
-
31
-
32
-
33
-
34
-
35
-
36
-
37
-
38
-
39
-
40
-
41
-
42
-
43
-
44
-
45
-
46
-
47
-
48
-
49
-
50
-
51
-
52
-
53
-
54
-
55
-
56
-
57
-
58
-
59
-
60
-
61
-
62
-
63
-
64
-
65
-
66
-
67
-
68
-
69
-
70
-
71
-
72
-
73
-
74
-
75
-
76
-
77
-
78
-
79
-
80
-
81
-
82
-
83
-
84
-
85
-
86
-
87
-
88
-
89
-
90
-
91
-
92
-
93
-
94
-
95
-
96
-
97
-
98
-
99
-
100
-
101
-
102
-
103
-
104
-
105
-
106
-
107
-
108
-
109
-
110
-
111
-
112
-
113
-
114
-
115
-
116
-
117
-
118
-
119
-
120
-
121
-
122
-
123
-
124
-
125
-
126
-
127
-
128
-
129
-
130
-
131
-
132
-
133
-
134
-
 135
135 -
 136
136 -
 137
137 -
 138
138 -
 139
139 -
 140
140 -
 141
141 -
 142
142 -
 143
143 -
 144
144 -
 145
145 -
 146
146 -
 147
147 -
 148
148 -
 149
149 -
 150
150 -
 151
151 -
 152
152 -
 153
153 -
 154
154 -
 155
155 -
156
-
157
-
158
-
159
-
160
-
161
-
162
-
163
-
164
-
165
-
166
-
167
-
168
-
169
-
170
-
171
-
172
-
173
-
174
-
175
-
176
-
177
-
178
-
179
-
180
-
181
-
182
-
183
-
184
-
185
-
186
-
187
-
188
-
189
-
190
-
191
-
192
-
193
-
194
-
195
-
196
-
197
-
198
-
199
-
200
-
201
-
202
-
203
-
204
-
205
-
206
-
207
-
208
-
209
-
210
-
211
-
212
-
213
-
214
-
215
-
216
-
217
-
218
-
219
-
220
-
221
-
222
-
223
-
224
-
225
-
226
-
227
-
228
-
229
-
230
-
231
-
232
-
233
-
234
-
235
-
236
-
237
-
238
-
239
-
240
-
241
-
242
-
243
-
244
-
245
-
246
-
247
-
248
-
249
-
250
-
251
-
252
-
253
-
254
-
255
-
256
-
257
-
258
-
259
-
260
-
261
-
262
-
263
-
264
-
265
-
266
 |
 |

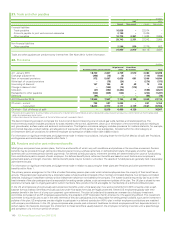
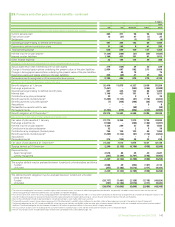
23. Pensions and other post-retirement benefits – continued
In the Eurozone, there are defined benefit pension plans in Germany, France, the Netherlands and other countries. In Germany and France, the majority
of the pensions are unfunded, in line with market practice. In Germany, the group’s largest Eurozone plan, employees receive a pension and also have
a choice to supplement their core pension through salary sacrifice. For employees who joined since 2002 the core pension benefit is a career average
plan with retirement benefits based on such factors as an employee’s pensionable salary and length of service. The returns on the notional
contributions made by both the company and employees are set out in German tax law. Retired German employees take their pension benefit typically
in the form of an annuity. The German plan is governed by legal agreements between BP and the works council or between BP and the trade union.
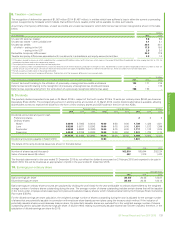
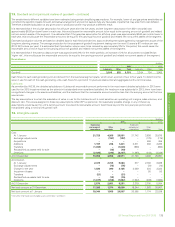
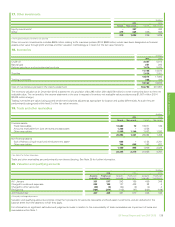
The level of contributions to funded defined benefit plans is the amount needed to provide adequate funds to meet pension obligations as they fall due.
During 2015 the aggregate level of contributions was $1,066 million (2014 $1,252 million and 2013 $1,272 million). The aggregate level of contributions
in 2016 is expected to be approximately $1,050 million, and includes contributions in all countries that we expect to be required to make contributions
by law or under contractual agreements, as well as an allowance for discretionary funding.
For the primary UK plan there is a funding agreement between the group and the trustee. On an annual basis the latest funding position is reviewed
and a schedule of contributions covering the next seven years is agreed. The funding agreement can be terminated unilaterally by either party with two
years’ notice. Contractually committed funding therefore represents nine years of future contributions, which amounted to $4,374 million at
31 December 2015, of which $1,437 million relates to past service. This amount is included in the group’s committed cash flows relating to pensions
and other post-retirement benefit plans as set out in the table of contractual obligations on page 220. The surplus relating to the primary UK pension
plan is recognized on the balance sheet on the basis that the company is entitled to a refund of any remaining assets once all members have left the
plan.
Pension contributions in the US are determined by legislation and are supplemented by discretionary contributions. All of the contributions made into
the US pension plan in 2015 were discretionary and no statutory funding requirement is expected in the next 12 months.
There was no minimum funding requirement for the US plan, and no significant minimum funding requirements in other countries at 31 December
2015.
The obligation and cost of providing pensions and other post-retirement benefits is assessed annually using the projected unit credit method. The date
of the most recent actuarial review was 31 December 2015. The UK plans are subject to a formal actuarial valuation every three years; valuations are
required more frequently in many other countries. The most recent formal actuarial valuation of the UK pension plans was as at 31 December 2014.
A valuation of the US plan is carried out annually.
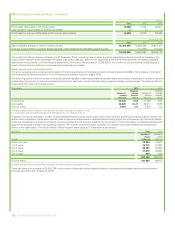
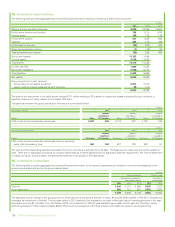
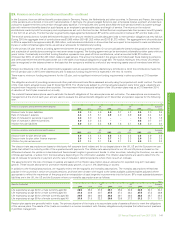
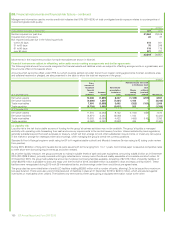
The material financial assumptions used to estimate the benefit obligations of the various plans are set out below. The assumptions are reviewed by
management at the end of each year, and are used to evaluate the accrued benefit obligation at 31 December and pension expense for the following
year.
%
Financial assumptions used to determine benefit obligation
2015 2014
UK
2013 2015 2014
US
2013 2015 2014
Eurozone
2013
Discount rate for plan liabilities 3.9 3.6 4.6 4.0 3.7 4.3 2.4 2.0 3.6
Rate of increase in salaries 4.4 4.5 5.1 3.9 4.0 3.9 3.2 3.4 3.4
Rate of increase for pensions in payment 3.0 3.0 3.3 –––1.6 1.8 1.8
Rate of increase in deferred pensions 3.0 3.0 3.3 –––0.6 0.7 0.7
Inflation for plan liabilities 3.0 3.0 3.3 1.5 1.6 2.1 1.8 2.0 2.0
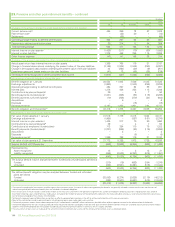
%
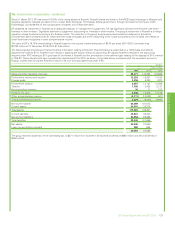
Financial assumptions used to determine benefit expense
2015 2014
UK
2013 2015 2014
US
2013 2015 2014
Eurozone
2013
Discount rate for plan service cost 3.9 4.8 4.4 3.8 4.6 3.3 2.3 3.9 3.5
Discount rate for plan other finance expense 3.6 4.6 4.4 3.7 4.3 3.3 2.0 3.6 3.5
Inflation for plan service cost 3.1 3.4 3.1 1.6 2.1 2.4 2.0 2.0 2.0
The discount rate assumptions are based on third-party AA corporate bond indices and for our largest plans in the UK, US and the Eurozone we use
yields that reflect the maturity profile of the expected benefit payments. The inflation rate assumptions for our UK and US plans are based on the
difference between the yields on index-linked and fixed-interest long-term government bonds. In other countries, including the Eurozone, we use one
of these approaches, or advice from the local actuary depending on the information available. The inflation assumptions are used to determine the
rate of increase for pensions in payment and the rate of increase in deferred pensions where there is such an increase.
The assumptions for the rate of increase in salaries are based on the inflation assumption plus an allowance for expected long-term real salary
growth. These include allowance for promotion-related salary growth, of up to 1.0% depending on country.
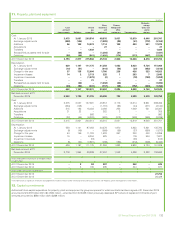
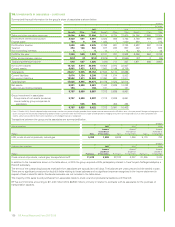
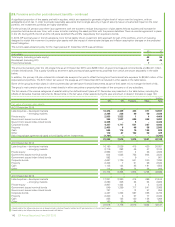
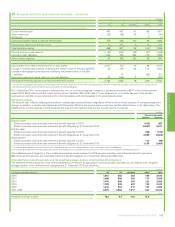
In addition to the financial assumptions, we regularly review the demographic and mortality assumptions. The mortality assumptions reflect best
practice in the countries in which we provide pensions, and have been chosen with regard to the latest available published tables adjusted where
appropriate to reflect the experience of the group and an extrapolation of past longevity improvements into the future. BP’s most substantial pension
liabilities are in the UK, the US and the Eurozone where our mortality assumptions are as follows:
Years
Mortality assumptions
2015 2014
UK
2013 2015 2014
US
2013 2015 2014
Eurozone
2013
Life expectancy at age 60 for a male currently aged 60 28.5 28.3 27.8 25.7 25.6 24.9 24.9 24.7 24.4
Life expectancy at age 60 for a male currently aged 40 31.0 30.9 30.7 27.5 27.4 26.4 27.5 27.3 26.9
Life expectancy at age 60 for a female currently aged 60 29.5 29.4 29.5 29.2 29.1 26.5 28.8 28.7 28.5
Life expectancy at age 60 for a female currently aged 40 31.9 31.8 32.2 30.9 30.9 27.3 31.2 31.1 30.7
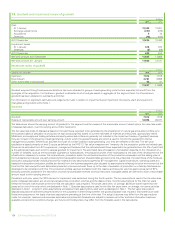
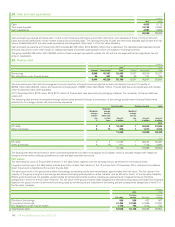
Pension plan assets are generally held in trusts. The primary objective of the trusts is to accumulate pools of assets sufficient to meet the obligations
of the various plans. The assets of the trusts are invested in a manner consistent with fiduciary obligations and principles that reflect current practices
in portfolio management.
BP Annual Report and Form 20-F 2015 141
Financial statements