BP 2015 Annual Report Download - page 54
Download and view the complete annual report
Please find page 54 of the 2015 BP annual report below. You can navigate through the pages in the report by either clicking on the pages listed below, or by using the keyword search tool below to find specific information within the annual report.-
 1
1 -
2
-
3
-
4
-
5
-
6
-
7
-
8
-
9
-
10
-
11
-
12
-
13
-
14
-
15
-
16
-
17
-
18
-
19
-
20
-
21
-
22
-
23
-
24
-
25
-
26
-
27
-
28
-
29
-
30
-
31
-
32
-
33
-
34
-
35
-
36
-
37
-
38
-
39
-
40
-
41
-
42
-
43
-
 44
44 -
 45
45 -
 46
46 -
 47
47 -
 48
48 -
 49
49 -
 50
50 -
 51
51 -
 52
52 -
 53
53 -
 54
54 -
 55
55 -
 56
56 -
 57
57 -
 58
58 -
 59
59 -
 60
60 -
 61
61 -
 62
62 -
 63
63 -
 64
64 -
65
-
66
-
67
-
68
-
69
-
70
-
71
-
72
-
73
-
74
-
75
-
76
-
77
-
78
-
79
-
80
-
81
-
82
-
83
-
84
-
85
-
86
-
87
-
88
-
89
-
90
-
91
-
92
-
93
-
94
-
95
-
96
-
97
-
98
-
99
-
100
-
101
-
102
-
103
-
104
-
105
-
106
-
107
-
108
-
109
-
110
-
111
-
112
-
113
-
114
-
115
-
116
-
117
-
118
-
119
-
120
-
121
-
122
-
123
-
124
-
125
-
126
-
127
-
128
-
129
-
130
-
131
-
132
-
133
-
134
-
135
-
136
-
137
-
138
-
139
-
140
-
141
-
142
-
143
-
144
-
145
-
146
-
147
-
148
-
149
-
150
-
151
-
152
-
153
-
154
-
155
-
156
-
157
-
158
-
159
-
160
-
161
-
162
-
163
-
164
-
165
-
166
-
167
-
168
-
169
-
170
-
171
-
172
-
173
-
174
-
175
-
176
-
177
-
178
-
179
-
180
-
181
-
182
-
183
-
184
-
185
-
186
-
187
-
188
-
189
-
190
-
191
-
192
-
193
-
194
-
195
-
196
-
197
-
198
-
199
-
200
-
201
-
202
-
203
-
204
-
205
-
206
-
207
-
208
-
209
-
210
-
211
-
212
-
213
-
214
-
215
-
216
-
217
-
218
-
219
-
220
-
221
-
222
-
223
-
224
-
225
-
226
-
227
-
228
-
229
-
230
-
231
-
232
-
233
-
234
-
235
-
236
-
237
-
238
-
239
-
240
-
241
-
242
-
243
-
244
-
245
-
246
-
247
-
248
-
249
-
250
-
251
-
252
-
253
-
254
-
255
-
256
-
257
-
258
-
259
-
260
-
261
-
262
-
263
-
264
-
265
-
266
 |
 |

Attracting and retaining the right people
The complex projects we work on require a wide range of specialist skills
– from the capability to explore for new sources of energy through to those
required for transporting and distributing hydrocarbons safely around the
world. We have a bias towards building capability and promoting from
within the organization and complement this with selective external
recruitment. In 2015 90% of senior leadership roles were recruited from
within BP.
We decided to maintain graduate recruitment in 2015, albeit at a reduced
level, with a total of 298 graduates joining BP during the year (2014 670,
2013 814). We have worked to maintain our visibility in the graduate job
market to help us attract the best recruits, and provide them with high
quality early development opportunities. For the second consecutive year
BP was the highest ranked energy-sector company in the UK in The Times
Top 100 Graduate Employers.
In 2015 46% of our graduate intake were women and 41% were from
outside the UK and US.
Building in-house capability
We provide a broad range of development opportunities for our people
– from on-the-job learning and mentoring through to online and classroom-
based courses.
Through our internal academies, we provide leading technical, functional,
compliance and leadership learning opportunities. We have six academies,
focusing on our operating management system, petrotechnical skills,
downstream, midstream, leadership, and functional skills, including finance
and legal.
Diversity
As a global business, we aim for a workforce representative of the
societies in which we operate. We set out our ambitions for diversity and
our group people committee reviews performance on a quarterly basis.
Our aim is for women to represent at least 25% of group leaders – our
most senior managers – by 2020 and we are actively seeking qualified
female candidates for our board.
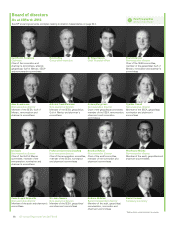
For more information on the composition of our board, see page 56.
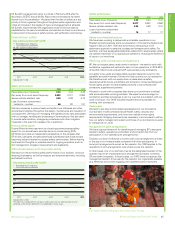
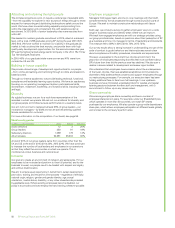
Workforce by gender
Numbers as at 31 December Male Female Female %
Board directors 12 320%
Group leaders 350 81 19%
Subsidiary directors 1,099 179 14%
All employees 54,581 25,234 32%
A total of 23% of our group leaders came from countries other than the
UK and US at the end of 2015 (2014 22%, 2013 22%). We have continued
to increase the number of local leaders and employees in our operations
so that they reflect the communities in which we operate. This is
monitored at a local, business and national level.
Inclusion
Our goal is to create an environment of inclusion and acceptance. For our
employees to be motivated and perform to their full potential, and for the
business to excel, our people need to be treated with respect and dignity
and without discrimination.
We aim to ensure equal opportunity in recruitment, career development,
promotion, training and reward for all employees – regardless of ethnicity,
national origin, religion, gender and gender identity, age, sexual
orientation, marital status, disability, or any other characteristic protected
by applicable laws. Where existing employees become disabled, our
policy is to provide continued employment and training wherever possible.
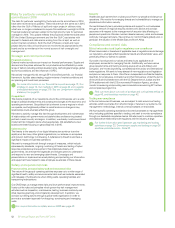
Employee engagement
Managers hold regular team and one-to-one meetings with their staff,
complemented by formal processes through works councils in parts of
Europe. We seek to maintain constructive relationships with labour
unions.
Each year, we conduct a survey to gather employees’ views on a wide
range of business topics and identify areas where we can improve.
We track how engaged employees are with our strategic priorities using
our group priorities index, based on questions about their perception of BP
as a business and how it is managed in terms of leadership and standards.
This measure fell to 69% in 2015 (2014 72%, 2013 72%).
Our survey results show a strong increase in understanding and use of the
code of conduct to guide behaviour and that employees remain clear
about compliance with safety procedures, standards and requirements.
However, as expected in the current low oil price environment, the
proportion of employees responding that they feel more confident about
BP’s future than they did the previous year has declined. We also saw a
decline in scores related to development and career opportunities.
We understand that employees have concerns about the consequences
of the lower oil price. We have established additional communications
channels to help address these concerns and support employees through
our restructuring processes. For example, our executive team has been
holding additional face-to-face town hall meetings. In our upstream
business we have introduced a dedicated inbox for queries and regular
listening sessions between frontline staff and management, with a
commitment to follow up on any issues raised.
Share ownership
We encourage employee share ownership and have a number of
employee share plans in place. For example, under our ShareMatch plan,
which operates in more than 50 countries, we match BP shares
purchased by our employees. We also operate a group-wide discretionary
share plan, which allows employee participation at different levels globally
and is linked to the company’s performance.
BP Annual Report and Form 20-F 201550