BP 2015 Annual Report Download - page 19
Download and view the complete annual report
Please find page 19 of the 2015 BP annual report below. You can navigate through the pages in the report by either clicking on the pages listed below, or by using the keyword search tool below to find specific information within the annual report.-
 1
1 -
2
-
3
-
4
-
5
-
6
-
7
-
8
-
 9
9 -
 10
10 -
 11
11 -
 12
12 -
 13
13 -
 14
14 -
 15
15 -
 16
16 -
 17
17 -
 18
18 -
 19
19 -
 20
20 -
 21
21 -
 22
22 -
 23
23 -
 24
24 -
 25
25 -
 26
26 -
 27
27 -
 28
28 -
 29
29 -
30
-
31
-
32
-
33
-
34
-
35
-
36
-
37
-
38
-
39
-
40
-
41
-
42
-
43
-
44
-
45
-
46
-
47
-
48
-
49
-
50
-
51
-
52
-
53
-
54
-
55
-
56
-
57
-
58
-
59
-
60
-
61
-
62
-
63
-
64
-
65
-
66
-
67
-
68
-
69
-
70
-
71
-
72
-
73
-
74
-
75
-
76
-
77
-
78
-
79
-
80
-
81
-
82
-
83
-
84
-
85
-
86
-
87
-
88
-
89
-
90
-
91
-
92
-
93
-
94
-
95
-
96
-
97
-
98
-
99
-
100
-
101
-
102
-
103
-
104
-
105
-
106
-
107
-
108
-
109
-
110
-
111
-
112
-
113
-
114
-
115
-
116
-
117
-
118
-
119
-
120
-
121
-
122
-
123
-
124
-
125
-
126
-
127
-
128
-
129
-
130
-
131
-
132
-
133
-
134
-
135
-
136
-
137
-
138
-
139
-
140
-
141
-
142
-
143
-
144
-
145
-
146
-
147
-
148
-
149
-
150
-
151
-
152
-
153
-
154
-
155
-
156
-
157
-
158
-
159
-
160
-
161
-
162
-
163
-
164
-
165
-
166
-
167
-
168
-
169
-
170
-
171
-
172
-
173
-
174
-
175
-
176
-
177
-
178
-
179
-
180
-
181
-
182
-
183
-
184
-
185
-
186
-
187
-
188
-
189
-
190
-
191
-
192
-
193
-
194
-
195
-
196
-
197
-
198
-
199
-
200
-
201
-
202
-
203
-
204
-
205
-
206
-
207
-
208
-
209
-
210
-
211
-
212
-
213
-
214
-
215
-
216
-
217
-
218
-
219
-
220
-
221
-
222
-
223
-
224
-
225
-
226
-
227
-
228
-
229
-
230
-
231
-
232
-
233
-
234
-
235
-
236
-
237
-
238
-
239
-
240
-
241
-
242
-
243
-
244
-
245
-
246
-
247
-
248
-
249
-
250
-
251
-
252
-
253
-
254
-
255
-
256
-
257
-
258
-
259
-
260
-
261
-
262
-
263
-
264
-
265
-
266
 |
 |

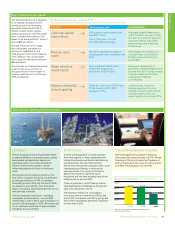
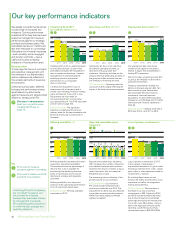
How we deliver How we measure Strategy in action in 2015
Creating shareholder value by generating
sustainable free cash flow over the long term
Recordable injury
frequency, loss of primary
containment, greenhouse
gas emissions, tier 1
process safety events.
Proved reserves
replacement ratio.
Operating cash flow,
gearing, total shareholder
return, underlying
replacement cost profit
per ordinary share.
Production.
Major project delivery.
Refining availability.
We seek efficient ways to deliver projects on
time and on budget, from planning through to
day-to-day operations. Our wide-ranging project
experience makes us a valued partner and
enhances our ability to compete.
We benefit from our high-performing fuels,
lubricants, petrochemicals and biofuels
businesses. Through premium products,
powerful brands and supply and trading,
Downstream provides strong cash generation
for the group.
20
tier 1 process
safety events
2014: 28
61%
reserves
replacement ratioa
2014: 63%
3.3
million barrels of oil
equivalent per daya
2014: 3.2 million
3
major project start-ups
in Upstream
2014: 7
94.7%
refining availability
2014: 94.9%
We prioritize the safety and reliability of our
operations to protect the welfare of our
workforce, local communities and the
environment, and to improve the efficiency of
our operations. This also helps preserve value
and secure our right to operate around the world.
We target opportunities with the greatest
potential to increase value, using our commercial
agility and technical capability. This allows us to
build a strong pipeline for future growth.
We rigorously screen our investments and we work
to keep our annual capital expenditure within a set
range. Ongoing management of our portfolio helps
ensure focus on more value-driven propositions.
We balance funds between shareholder
distributions and investment for the future.
We are strengthening our portfolio of high-return
and longer-life assets – across deep water, giant
fields, gas value chains and unconventionals – to
provide BP with momentum for years to come.
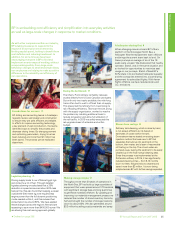
Improving reliability
Improvement plans are
increasing UK North Sea
plant reliability.
See page 44.
Capturing value
Improving the quality of
future investments.
See page 30.
Adapting rapidly
Using local knowledge to
increase our competitiveness.
See page 29.
Unlocking energy potential
Investing in exploration and
development in Egypt.
See page 33.
Optimizing our assets
Using our technical expertise
to maintain a secure and
reliable supply.
See page 31.
Improving operations
Improvements at Castellón
refinery are helping to
increase profitability.
See page 36.
Proven expertise
Our talented people help to drive our business
forward. They apply their diverse skills and
expertise to deliver complex projects across
all areas of our business.
Strong relationships
We aim to form enduring partnerships in the
countries in which we operate, building strong
relationships with governments, customers,
partners, suppliers and communities to create
mutual advantage. Co-operation helps unlock
resources found in challenging locations and
transforms them into products for our
customers.
Advanced technology
We develop and deploy technologies we
expect to make the greatest impact on our
businesses – from enhancing the safety and
reliability of our operations to creating
competitive advantage in energy discovery,
recovery, efficiency and products.
★ Defined on page 256.BP Annual Report and Form 20-F 2015 15
Strategic reportStrategic report
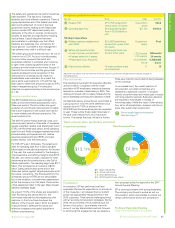
$19.1bn
operating cash flow
2014: $32.8bn
a On a combined basis of subsidiaries and equity-accounted entities.