BP 2015 Annual Report Download - page 130
Download and view the complete annual report
Please find page 130 of the 2015 BP annual report below. You can navigate through the pages in the report by either clicking on the pages listed below, or by using the keyword search tool below to find specific information within the annual report.-
 1
1 -
2
-
3
-
4
-
5
-
6
-
7
-
8
-
9
-
10
-
11
-
12
-
13
-
14
-
15
-
16
-
17
-
18
-
19
-
20
-
21
-
22
-
23
-
24
-
25
-
26
-
27
-
28
-
29
-
30
-
31
-
32
-
33
-
34
-
35
-
36
-
37
-
38
-
39
-
40
-
41
-
42
-
43
-
44
-
45
-
46
-
47
-
48
-
49
-
50
-
51
-
52
-
53
-
54
-
55
-
56
-
57
-
58
-
59
-
60
-
61
-
62
-
63
-
64
-
65
-
66
-
67
-
68
-
69
-
70
-
71
-
72
-
73
-
74
-
75
-
76
-
77
-
78
-
79
-
80
-
81
-
82
-
83
-
84
-
85
-
86
-
87
-
88
-
89
-
90
-
91
-
92
-
93
-
94
-
95
-
96
-
97
-
98
-
99
-
100
-
101
-
102
-
103
-
104
-
105
-
106
-
107
-
108
-
109
-
110
-
111
-
112
-
113
-
114
-
115
-
116
-
117
-
118
-
119
-
 120
120 -
 121
121 -
 122
122 -
 123
123 -
 124
124 -
 125
125 -
 126
126 -
 127
127 -
 128
128 -
 129
129 -
 130
130 -
 131
131 -
 132
132 -
 133
133 -
 134
134 -
 135
135 -
 136
136 -
 137
137 -
 138
138 -
 139
139 -
 140
140 -
141
-
142
-
143
-
144
-
145
-
146
-
147
-
148
-
149
-
150
-
151
-
152
-
153
-
154
-
155
-
156
-
157
-
158
-
159
-
160
-
161
-
162
-
163
-
164
-
165
-
166
-
167
-
168
-
169
-
170
-
171
-
172
-
173
-
174
-
175
-
176
-
177
-
178
-
179
-
180
-
181
-
182
-
183
-
184
-
185
-
186
-
187
-
188
-
189
-
190
-
191
-
192
-
193
-
194
-
195
-
196
-
197
-
198
-
199
-
200
-
201
-
202
-
203
-
204
-
205
-
206
-
207
-
208
-
209
-
210
-
211
-
212
-
213
-
214
-
215
-
216
-
217
-
218
-
219
-
220
-
221
-
222
-
223
-
224
-
225
-
226
-
227
-
228
-
229
-
230
-
231
-
232
-
233
-
234
-
235
-
236
-
237
-
238
-
239
-
240
-
241
-
242
-
243
-
244
-
245
-
246
-
247
-
248
-
249
-
250
-
251
-
252
-
253
-
254
-
255
-
256
-
257
-
258
-
259
-
260
-
261
-
262
-
263
-
264
-
265
-
266
 |
 |

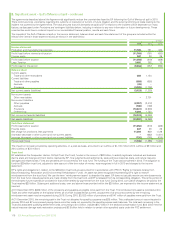
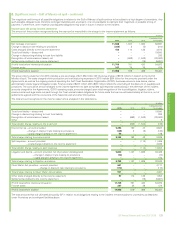
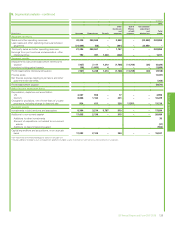
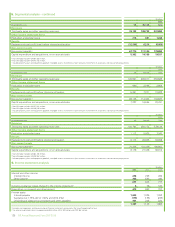
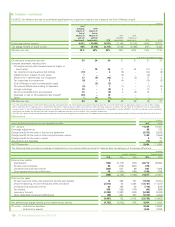
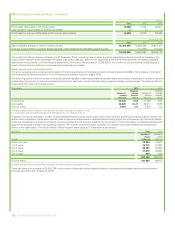
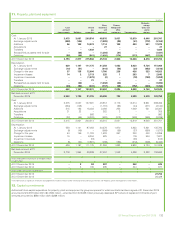
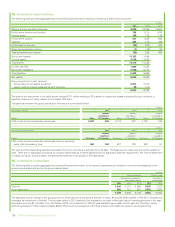
5. Segmental analysis – continued
$ million
2014
By business Upstream Downstream Rosneft
Other
businesses
and
corporate
Gulf of
Mexico
oil spill
response
Consolidation
adjustment
and
eliminations
Total
group
Segment revenues
Sales and other operating revenues 65,424 323,486 – 1,989 – (37,331) 353,568
Less: sales and other operating revenues between
segments (36,643) 173 – (861) – 37,331 –
Third party sales and other operating revenues 28,781 323,659 – 1,128 – – 353,568
Earnings from joint ventures and associates – after interest
and tax 1,089 265 2,101 (83) – – 3,372
Segment results
Replacement cost profit (loss) before interest and taxation 8,934 3,738 2,100 (2,010) (781) 641 12,622
Inventory holding gains (losses)a(86) (6,100) (24) – – – (6,210)
Profit (loss) before interest and taxation 8,848 (2,362) 2,076 (2,010) (781) 641 6,412
Finance costs (1,148)
Net finance expense relating to pensions and other post-
retirement benefits (314)
Profit before taxation 4,950
Other income statement items
Depreciation, depletion and amortizationb
US 4,129 984 – 97 – – 5,210
Non-US 8,404 1,336 – 213 – – 9,953
Charges for provisions, net of write-back of unused
provisions, including change in discount rate 260 713 – 323 1,329 – 2,625
Segment assets
Investments in joint ventures and associates 7,877 3,244 7,312 723 – – 19,156
Additions to non-current assetsc22,587 3,121 – 784 – – 26,492
Additions to other investments 160
Element of acquisitions not related to non-current assets (366)
Additions to decommissioning asset (2,505)
Capital expenditure and acquisitions, on an accruals basis 19,772 3,106 – 903 – – 23,781
aSee explanation of inventory holding gains and losses on page 124.
bIt is estimated that the benefit arising from the absence of depreciation for the assets held for sale during the year was $221 million.
cIncludes additions to property, plant and equipment; goodwill; intangible assets; investments in joint ventures; and investments in associates.
126 BP Annual Report and Form 20-F 2015