BP 2015 Annual Report Download - page 25
Download and view the complete annual report
Please find page 25 of the 2015 BP annual report below. You can navigate through the pages in the report by either clicking on the pages listed below, or by using the keyword search tool below to find specific information within the annual report.-
 1
1 -
2
-
3
-
4
-
5
-
6
-
7
-
8
-
9
-
10
-
11
-
12
-
13
-
14
-
 15
15 -
 16
16 -
 17
17 -
 18
18 -
 19
19 -
 20
20 -
 21
21 -
 22
22 -
 23
23 -
 24
24 -
 25
25 -
 26
26 -
 27
27 -
 28
28 -
 29
29 -
 30
30 -
 31
31 -
 32
32 -
 33
33 -
 34
34 -
 35
35 -
36
-
37
-
38
-
39
-
40
-
41
-
42
-
43
-
44
-
45
-
46
-
47
-
48
-
49
-
50
-
51
-
52
-
53
-
54
-
55
-
56
-
57
-
58
-
59
-
60
-
61
-
62
-
63
-
64
-
65
-
66
-
67
-
68
-
69
-
70
-
71
-
72
-
73
-
74
-
75
-
76
-
77
-
78
-
79
-
80
-
81
-
82
-
83
-
84
-
85
-
86
-
87
-
88
-
89
-
90
-
91
-
92
-
93
-
94
-
95
-
96
-
97
-
98
-
99
-
100
-
101
-
102
-
103
-
104
-
105
-
106
-
107
-
108
-
109
-
110
-
111
-
112
-
113
-
114
-
115
-
116
-
117
-
118
-
119
-
120
-
121
-
122
-
123
-
124
-
125
-
126
-
127
-
128
-
129
-
130
-
131
-
132
-
133
-
134
-
135
-
136
-
137
-
138
-
139
-
140
-
141
-
142
-
143
-
144
-
145
-
146
-
147
-
148
-
149
-
150
-
151
-
152
-
153
-
154
-
155
-
156
-
157
-
158
-
159
-
160
-
161
-
162
-
163
-
164
-
165
-
166
-
167
-
168
-
169
-
170
-
171
-
172
-
173
-
174
-
175
-
176
-
177
-
178
-
179
-
180
-
181
-
182
-
183
-
184
-
185
-
186
-
187
-
188
-
189
-
190
-
191
-
192
-
193
-
194
-
195
-
196
-
197
-
198
-
199
-
200
-
201
-
202
-
203
-
204
-
205
-
206
-
207
-
208
-
209
-
210
-
211
-
212
-
213
-
214
-
215
-
216
-
217
-
218
-
219
-
220
-
221
-
222
-
223
-
224
-
225
-
226
-
227
-
228
-
229
-
230
-
231
-
232
-
233
-
234
-
235
-
236
-
237
-
238
-
239
-
240
-
241
-
242
-
243
-
244
-
245
-
246
-
247
-
248
-
249
-
250
-
251
-
252
-
253
-
254
-
255
-
256
-
257
-
258
-
259
-
260
-
261
-
262
-
263
-
264
-
265
-
266
 |
 |

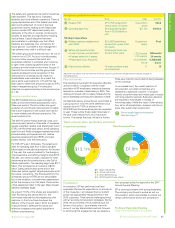
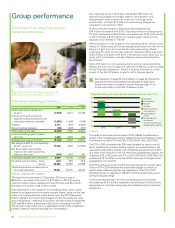
Reserves replacement ratio (%) Production (mboe/d)Total shareholder return (%)
We report tier 1 process safety events,
which are the losses of primary
containment of greatest consequence
– causing harm to a member of the
workforce, costly damage to equipment
or exceeding defined quantities.
2015 performance The number of tier 1
process safety events has decreased
substantially since 2011. We believe
our systematic approach to safety
management and assurance is
contributing to improved performance
over the long term and will maintain our
focus in these areas.
We provide data on greenhouse gas
(GHG) emissions material to our business
on a carbon dioxide-equivalent basis. This
includes carbon dioxide (CO2) and
methane for direct emissions. Our GHG
KPI encompasses all BP’s consolidated
entities as well as our share of
equity-accounted entities other than BP’s
share of TNK-BP and Rosneft.c
2015 performance The increase in our
reported emissions is due to updating the
global warming potential for methane.
Without this update, our emissions
would have decreased primarily due to
divestments in Alaska.
We track how engaged our employees
are with our strategic priorities using our
group priorities index. This is derived
from survey questions about their
perceptions of BP as a company and
how it is managed in terms of leadership
and standards.
2015 performance Our group priorities
engagement measure fell slightly in 2015,
as expected in the current low oil price
environment.
Each year we report the percentage of
women and individuals from countries
other than the UK and the US among
BP’s group leaders. This helps us track
progress in building a diverse and
well-balanced leadership team.
2015 performance The percentage of
our group leaders who are women or
non-UK/US rose slightly. We remain
committed to our aim that women will
represent at least 25% of our group
leaders by 2020.
Tier 1 process safety events aGreenhouse gas emissionsb
(million tonnes of CO2 equivalent)
Group priorities indexd (%) Diversity and inclusiond (%)
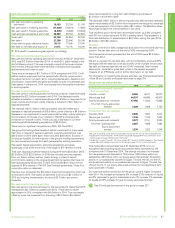
Major project delivery
Major projects are defined as those with
a BP net investment of at least $250
million, or considered to be of strategic
importance to BP, or of a high degree
of complexity.
We monitor the progress of our major
projects to gauge whether we are
delivering our core pipeline of activity.
Projects take many years to complete,
requiring differing amounts of resource,
so a smooth or increasing trend should
not be anticipated.
2015 performance We delivered three
major projects in Upstream – two in
Angola and one in Asia Pacific, and
started up Zhuhai 3 in Downstream.
d Relates to BP employees.
b The 2015 figure reflects our update of the
global warming potential for methane from
21 to 25, in line with IPIECA’s guidelines.
c For more information on our GHG emissions
see page 46.
Total shareholder return (TSR)
represents the change in value of a
BP shareholding over a calendar year.
It assumes that dividends are reinvested
to purchase additional shares at the
closing price on the ex-dividend date.
We are committed to maintaining a
progressive and sustainable dividend
policy.
2015 performance Negative TSR in the
year reflects the fall in the BP share price
exceeding the dividend.
Proved reserves replacement ratio is the
extent to which the year’s production has
been replaced by proved reserves added
to our reserve base.
The ratio is expressed in oil-equivalent
terms and includes changes resulting from
discoveries, improved recovery and
extensions and revisions to previous
estimates, but excludes changes resulting
from acquisitions and disposals. The ratio
reflects both subsidiaries and equity-
accounted entities.
This measure helps to demonstrate our
success in accessing, exploring and
extracting resources.
2015 performance This year’s reserves
replacement ratio was similar to 2014. See
page 229 for more information.
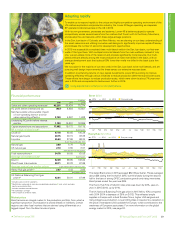
We report production of crude oil,
condensate, natural gas liquids (NGLs),
natural bitumen and natural gas on a
volume per day basis for our subsidiaries
and equity-accounted entities. Natural
gas is converted to barrels of oil
equivalent at 5,800 standard cubic feet of
natural gas = 1 boe.
2015 performance BP’s total reported
production including Upstream and
Rosneft segments was 4.0% higher
than in 2014. This was mainly due to
favourable entitlement impact in our
production-sharing agreements in the
Upstream segment.
2011 2012 2013 2014 2015
1
0
8
6
4
2
2
4
5
4
7
2011 2012 2013 2014 2015
6
0
4
0
2
0
0
-
20
2.5
3.0
4.5
2.6
ADS basis Ordinary share basis
(16.5)
(11.6)
(8.3)
14.7
14.0
(12.8)
2011 2012 2013 2014 2015
1
40
1
20
1
00
8
0
6
0
103
129
63 61
77
2011 2012 2013 2014 2015
3
,500
3
,400
3
,300
3
,200
3
,100
3,454
3,331
3,230
3,151
3,277
2011 2012 2013 2014 2015
1
00
8
0
6
0
4
0
2
0
74
43
20 20
28
2011 2012 2013 2014 2015
1
00
80
60
40
2
0
61.8 59.8
50.3 48.6 48.9
2011 2012 2013 2014 2015
1
00
8
0
6
0
4
0
2
0
71
67 72 72 69
2011 2012 2013 2014 2015
3
0
2
5
2
0
1
5
1
0
5
Women Non UK/US
15
19
17
18
20
22
18
19
22
23
a This represents reported incidents occurring
within BP’s operational HSSE reporting
boundary. That boundary includes BP’s own
operated facilities and certain other locations
or situations.
BP Annual Report and Form 20-F 2015 21
Strategic report
★ Defined on page 256.