BP 2015 Annual Report Download - page 234
Download and view the complete annual report
Please find page 234 of the 2015 BP annual report below. You can navigate through the pages in the report by either clicking on the pages listed below, or by using the keyword search tool below to find specific information within the annual report.-
 1
1 -
2
-
3
-
4
-
5
-
6
-
7
-
8
-
9
-
10
-
11
-
12
-
13
-
14
-
15
-
16
-
17
-
18
-
19
-
20
-
21
-
22
-
23
-
24
-
25
-
26
-
27
-
28
-
29
-
30
-
31
-
32
-
33
-
34
-
35
-
36
-
37
-
38
-
39
-
40
-
41
-
42
-
43
-
44
-
45
-
46
-
47
-
48
-
49
-
50
-
51
-
52
-
53
-
54
-
55
-
56
-
57
-
58
-
59
-
60
-
61
-
62
-
63
-
64
-
65
-
66
-
67
-
68
-
69
-
70
-
71
-
72
-
73
-
74
-
75
-
76
-
77
-
78
-
79
-
80
-
81
-
82
-
83
-
84
-
85
-
86
-
87
-
88
-
89
-
90
-
91
-
92
-
93
-
94
-
95
-
96
-
97
-
98
-
99
-
100
-
101
-
102
-
103
-
104
-
105
-
106
-
107
-
108
-
109
-
110
-
111
-
112
-
113
-
114
-
115
-
116
-
117
-
118
-
119
-
120
-
121
-
122
-
123
-
124
-
125
-
126
-
127
-
128
-
129
-
130
-
131
-
132
-
133
-
134
-
135
-
136
-
137
-
138
-
139
-
140
-
141
-
142
-
143
-
144
-
145
-
146
-
147
-
148
-
149
-
150
-
151
-
152
-
153
-
154
-
155
-
156
-
157
-
158
-
159
-
160
-
161
-
162
-
163
-
164
-
165
-
166
-
167
-
168
-
169
-
170
-
171
-
172
-
173
-
174
-
175
-
176
-
177
-
178
-
179
-
180
-
181
-
182
-
183
-
184
-
185
-
186
-
187
-
188
-
189
-
190
-
191
-
192
-
193
-
194
-
195
-
196
-
197
-
198
-
199
-
200
-
201
-
202
-
203
-
204
-
205
-
206
-
207
-
208
-
209
-
210
-
211
-
212
-
213
-
214
-
215
-
216
-
217
-
218
-
219
-
220
-
221
-
222
-
223
-
 224
224 -
 225
225 -
 226
226 -
 227
227 -
 228
228 -
 229
229 -
 230
230 -
 231
231 -
 232
232 -
 233
233 -
 234
234 -
 235
235 -
 236
236 -
 237
237 -
 238
238 -
 239
239 -
 240
240 -
 241
241 -
 242
242 -
 243
243 -
 244
244 -
245
-
246
-
247
-
248
-
249
-
250
-
251
-
252
-
253
-
254
-
255
-
256
-
257
-
258
-
259
-
260
-
261
-
262
-
263
-
264
-
265
-
266
 |
 |

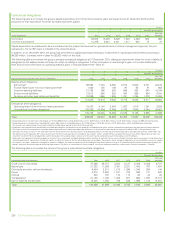
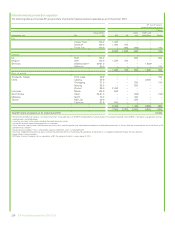
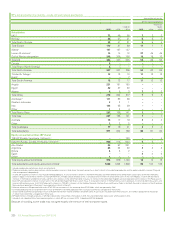
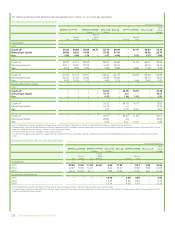
BP’s net production by country – crude oilaand natural gas liquids
thousand barrels per day
BP net share of productionb
2015 2014
Crude oil
2013 2015 2014
Natural gas
liquids
2013
Subsidiaries
UKcd 72 46 58 723
Norway 38 41 31 554
Total Rest of Europe 38 41 31 554
Total Europe 110 87 89 11 77
Alaskac107 127 137 –––
Lower 48 onshorec14 14 12 37 45 45
Gulf of Mexico deepwaterc203 206 156 19 18 13
Total US 323 347 305 56 63 58
Canada 3–– –––
Total Rest of North America 3–– –––
Total North America 327 347 305 56 63 58
Trinidad & Tobagoc12 13 10 11 12 12
Brazilc––7 –––
Total South America 12 13 17 11 12 12
Angola 221 181 180 –––
Egyptc42 37 33 –––
Algeria 653 753
Total Africa 270 222 217 753
Azerbaijanc111 98 96 –––
Western Indonesia 221 –––
Iraq 123 55 39 –––
Other 124 ––1
Total Rest of Asia 237 156 141 1–1
Total Asia 237 156 141 1–1
Australia 15 17 19 334
Other 222 –––
Total Australasia 17 19 21 334
Total subsidiaries 971 844 789 88 91 86
Equity-accounted entities (BP share)
TNK-BP (Russia, Venezuela, Vietnam)ce –– 183 ––4
Rosneft (Russia, Canada,Venezuela, Vietnam)cf 809 816 643 457
Abu Dhabig96 97 231 –––
Argentina 65 62 60 333
Bolivia 432 –––
Egypt ––– 345
Otherc111 –––
Total equity-accounted entities 974 979 1,120 10 12 19
Total subsidiaries and equity-accounted entitiesh1,946 1,823 1,909 99 104 105
aIncludes condensate and bitumen which are not material.
bProduction excludes royalties due to others whether payable in cash or in kind where the royalty owner has a direct interest in the underlying production and the option and ability to make lifting and
sales arrangements independently.
cIn 2015, BP acquired an interest in Taas-Yuryakh Neftegazodobycha. It also increased its interest in the North Alexandria and West Mediterranean Deep Water Concessions of the West Nile Delta
project in Egypt. It increased its interest in certain UK North Sea, Trinidad, and US onshore assets. It also decreased its interest in certain other assets in the same Regions. In 2014, BP divested its
interests in the Endicott and Northstar fields, and 50% of its interests in the Milne Point field, in Alaska, its interest in the US onshore Hugoton upstream operation and its interest in the Polvo asset in
Brazil. BP also reduced its interest in certain wells in the US onshore Eagle Ford Shale in south Texas. It increased its interest in the Shah Deniz asset in Azerbaijan, in certain UK North Sea assets, and
in certain US onshore assets. In 2013, BP divested its interests in TNK-BP, its interests in the Harding, Devenick, Maclure, Braes and Braemar fields in the North Sea and its interests in the US onshore
Moxa upstream operation in Wyoming. It also acquired an interest in Rosneft.
dVolumes relate to six BP-operated fields within ETAP. BP has no interests in the remaining three ETAP fields, which are operated by Shell.
eEstimated production for 2013 represents BP’s share of TNK-BP’s estimated production from 1 January to 20 March, averaged over the full year.
f2015 is based on preliminary operational results of Rosneft for the three months ended 31 December 2015. Actual results may differ from these amounts. 2013 reflects production for the period
21 March to 31 December, averaged over the full year.
gBP holds interests, through associates, in offshore concessions in Abu Dhabi which expire in 2018. We also held onshore concessions which expired in 2014.
hIncludes 4 net mboe/d of NGLs from processing plants in which BP has an interest (2014 7mboe/d and 2013 5.5mboe/d).
Because of rounding, some totals may not agree exactly with the sum of their component parts.
230 BP Annual Report and Form 20-F 2015