ADT 2009 Annual Report Download - page 84
Download and view the complete annual report
Please find page 84 of the 2009 ADT annual report below. You can navigate through the pages in the report by either clicking on the pages listed below, or by using the keyword search tool below to find specific information within the annual report.-
 1
1 -
2
-
3
-
4
-
5
-
6
-
7
-
8
-
9
-
10
-
11
-
12
-
13
-
14
-
15
-
16
-
17
-
18
-
19
-
20
-
21
-
22
-
23
-
24
-
25
-
26
-
27
-
28
-
29
-
30
-
31
-
32
-
33
-
34
-
35
-
36
-
37
-
38
-
39
-
40
-
41
-
42
-
43
-
44
-
45
-
46
-
47
-
48
-
49
-
50
-
51
-
52
-
53
-
54
-
55
-
56
-
57
-
58
-
59
-
60
-
61
-
62
-
63
-
64
-
65
-
66
-
67
-
68
-
69
-
70
-
71
-
72
-
73
-
 74
74 -
 75
75 -
 76
76 -
 77
77 -
 78
78 -
 79
79 -
 80
80 -
 81
81 -
 82
82 -
 83
83 -
 84
84 -
 85
85 -
 86
86 -
 87
87 -
 88
88 -
 89
89 -
 90
90 -
 91
91 -
 92
92 -
 93
93 -
 94
94 -
95
-
96
-
97
-
98
-
99
-
100
-
101
-
102
-
103
-
104
-
105
-
106
-
107
-
108
-
109
-
110
-
111
-
112
-
113
-
114
-
115
-
116
-
117
-
118
-
119
-
120
-
121
-
122
-
123
-
124
-
125
-
126
-
127
-
128
-
129
-
130
-
131
-
132
-
133
-
134
-
135
-
136
-
137
-
138
-
139
-
140
-
141
-
142
-
143
-
144
-
145
-
146
-
147
-
148
-
149
-
150
-
151
-
152
-
153
-
154
-
155
-
156
-
157
-
158
-
159
-
160
-
161
-
162
-
163
-
164
-
165
-
166
-
167
-
168
-
169
-
170
-
171
-
172
-
173
-
174
-
175
-
176
-
177
-
178
-
179
-
180
-
181
-
182
-
183
-
184
-
185
-
186
-
187
-
188
-
189
-
190
-
191
-
192
-
193
-
194
-
195
-
196
-
197
-
198
-
199
-
200
-
201
-
202
-
203
-
204
-
205
-
206
-
207
-
208
-
209
-
210
-
211
-
212
-
213
-
214
-
215
-
216
-
217
-
218
-
219
-
220
-
221
-
222
-
223
-
224
-
225
-
226
-
227
-
228
-
229
-
230
-
231
-
232
-
233
-
234
-
235
-
236
-
237
-
238
-
239
-
240
-
241
-
242
-
243
-
244
-
245
-
246
-
247
-
248
-
249
-
250
-
251
-
252
-
253
-
254
-
255
-
256
-
257
-
258
-
259
-
260
-
261
-
262
-
263
-
264
-
265
-
266
-
267
-
268
-
269
-
270
-
271
-
272
-
273
-
274
-
275
-
276
-
277
-
278
-
279
-
280
-
281
-
282
-
283
-
284
-
285
-
286
-
287
-
288
-
289
-
290
 |
 |

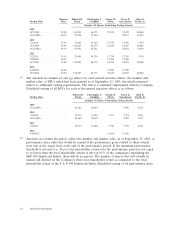
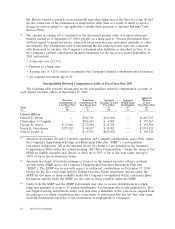
Mr. Breen’s benefit is payable as an actuarially equivalent lump sum at the later of (i) age 60 and
(ii) the actual date of his termination of employment other than as a result of death or upon a
change in control (subject to any applicable 6-month delay pursuant to Internal Revenue Code
Section 409A).
(2) The amount in column (d) is calculated as the discounted present value of normal retirement
benefits earned as of September 25, 2009, payable as a lump sum at ‘‘Normal Retirement Date’’
(without regard to projected service, projected salary increases, pre-retirement mortality or other
decrements). The assumptions used in determining the discounted present value are consistent
with those used to calculate the Company’s retirement plan liabilities as described in Note 16 to
the Company’s audited consolidated financial statements for the fiscal year ended September 25,
2009, and include:
• A discount rate of 5.5%;
• Payment as a lump sum;
• A prime rate of 3.25% (used to accumulate the Company’s defined contribution match balance);
• An assumed retirement age of 60.
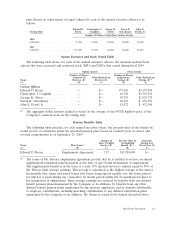
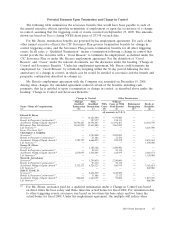
Non-Qualified Deferred Compensation Table at Fiscal Year-End 2009
The following table presents information on the non-qualified deferred compensation accounts of
each named executive officer at September 25, 2009.
Aggregate
Executive Registrant Aggregate Aggregate Balance
Contributions in Contributions in Earnings in Last Withdrawals/ at Last
Last Fiscal Year Last Fiscal Year Fiscal Year Distributions Fiscal Year End
Name ($)(1) ($)(1) ($)(2) ($)(3) ($)
(a) (b) (c) (d) (e) (f)
Current Officers
Edward D. Breen ....... — $224,729 $(16,260) — $1,415,783
Christopher J. Coughlin . . — $104,417 $ 9,908 — $ 373,567
George R. Oliver ....... $ 12,960 $ 72,050 $ 13,350 — $ 191,360
Naren K. Gursahaney .... $375,320 $ 48,817 $ 10,982 — $2,034,829
John E. Evard, Jr. ...... — $ 43,333 $(25,185) — $ 195,743
(1) Amounts in columns (b) and (c) include employee and Company contributions, respectively, under
the Company’s Supplemental Savings and Retirement Plan (the ‘‘SSRP’’), a non-qualified
retirement savings plan. All of the amounts shown in column (c) are included in the Summary
Compensation Table under the column heading ‘‘All Other Compensation.’’ Under the terms of the
SSRP, an eligible executive may choose to defer up to 50% of his or her base salary and up to
100% of his or her performance bonus.
(2) Amounts in column (d) include earnings or (losses) on the named executive officer’s notional
account in the SSRP and in the Company’s Supplemental Executive Retirement Plan (the
‘‘SERP’’). The SERP was frozen with respect to additional contributions on December 31, 2004.
Except for the Tyco stock fund and the Fidelity Freedom Funds, investment options under the
SSRP are the same as those available under the Company’s tax-qualified 401(k) retirement plans.
Investment options under the SERP are the same as those available under the SSRP.
(3) Under both the SSRP and the SERP, participants may elect to receive distributions in a single
lump sum payment or in up to 15 annual installments. A participant who is still employed by Tyco
may begin receiving distributions under each plan after a minimum of five years have elapsed from
the plan year for which contributions have been made. A participant who has left Tyco may begin
receiving distributions upon his or her termination of employment or retirement.
64 2010 Proxy Statement