ADT 2009 Annual Report Download - page 179
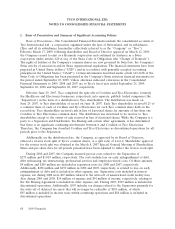
Download and view the complete annual report
Please find page 179 of the 2009 ADT annual report below. You can navigate through the pages in the report by either clicking on the pages listed below, or by using the keyword search tool below to find specific information within the annual report.-
 1
1 -
2
-
3
-
4
-
5
-
6
-
7
-
8
-
9
-
10
-
11
-
12
-
13
-
14
-
15
-
16
-
17
-
18
-
19
-
20
-
21
-
22
-
23
-
24
-
25
-
26
-
27
-
28
-
29
-
30
-
31
-
32
-
33
-
34
-
35
-
36
-
37
-
38
-
39
-
40
-
41
-
42
-
43
-
44
-
45
-
46
-
47
-
48
-
49
-
50
-
51
-
52
-
53
-
54
-
55
-
56
-
57
-
58
-
59
-
60
-
61
-
62
-
63
-
64
-
65
-
66
-
67
-
68
-
69
-
70
-
71
-
72
-
73
-
74
-
75
-
76
-
77
-
78
-
79
-
80
-
81
-
82
-
83
-
84
-
85
-
86
-
87
-
88
-
89
-
90
-
91
-
92
-
93
-
94
-
95
-
96
-
97
-
98
-
99
-
100
-
101
-
102
-
103
-
104
-
105
-
106
-
107
-
108
-
109
-
110
-
111
-
112
-
113
-
114
-
115
-
116
-
117
-
118
-
119
-
120
-
121
-
122
-
123
-
124
-
125
-
126
-
127
-
128
-
129
-
130
-
131
-
132
-
133
-
134
-
135
-
136
-
137
-
138
-
139
-
140
-
141
-
142
-
143
-
144
-
145
-
146
-
147
-
148
-
149
-
150
-
151
-
152
-
153
-
154
-
155
-
156
-
157
-
158
-
159
-
160
-
161
-
162
-
163
-
164
-
165
-
166
-
167
-
168
-
 169
169 -
 170
170 -
 171
171 -
 172
172 -
 173
173 -
 174
174 -
 175
175 -
 176
176 -
 177
177 -
 178
178 -
 179
179 -
 180
180 -
 181
181 -
 182
182 -
 183
183 -
 184
184 -
 185
185 -
 186
186 -
 187
187 -
 188
188 -
 189
189 -
190
-
191
-
192
-
193
-
194
-
195
-
196
-
197
-
198
-
199
-
200
-
201
-
202
-
203
-
204
-
205
-
206
-
207
-
208
-
209
-
210
-
211
-
212
-
213
-
214
-
215
-
216
-
217
-
218
-
219
-
220
-
221
-
222
-
223
-
224
-
225
-
226
-
227
-
228
-
229
-
230
-
231
-
232
-
233
-
234
-
235
-
236
-
237
-
238
-
239
-
240
-
241
-
242
-
243
-
244
-
245
-
246
-
247
-
248
-
249
-
250
-
251
-
252
-
253
-
254
-
255
-
256
-
257
-
258
-
259
-
260
-
261
-
262
-
263
-
264
-
265
-
266
-
267
-
268
-
269
-
270
-
271
-
272
-
273
-
274
-
275
-
276
-
277
-
278
-
279
-
280
-
281
-
282
-
283
-
284
-
285
-
286
-
287
-
288
-
289
-
290
 |
 |

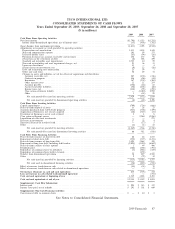
TYCO INTERNATIONAL LTD.
CONSOLIDATED STATEMENTS OF CASH FLOWS
Years Ended September 25, 2009, September 26, 2008 and September 28, 2007
($ in millions)
2009 2008 2007
Cash Flows From Operating Activities:
Net (loss) income ....................................................... $(1,798) $ 1,553 $(1,742)
Income from discontinued operations, net of income taxes ............................. (35) (458) (782)
(Loss) Income from continuing operations ........................................ (1,833) 1,095 (2,524)
Adjustments to reconcile net cash provided by operating activities:
Depreciation and amortization .............................................. 1,133 1,154 1,148
Non-cash compensation expense ............................................. 103 99 173
Deferred income taxes ................................................... (83) (94) (16)
Provision for losses on accounts receivable and inventory .............................. 156 135 94
(Gain) loss on the retirement of debt .......................................... (2) 258 259
Goodwill and intangible asset impairments ....................................... 2,705 10 59
Non-cash restructuring and asset impairment charges, net .............................. 23 36 11
Losses on divestitures ................................................... 13 — 4
(Gains) losses on investments, net ............................................ (9) 13 (10)
Debt and refinancing cost amortization ......................................... 25 59 7
Other non-cash items .................................................... 56 29 31
Changes in assets and liabilities, net of the effects of acquisitions and divestitures:
Accounts receivable, net ................................................. 207 (176) (136)
Contracts in progress .................................................. 106 (26) (44)
Inventories ........................................................ 367 (138) (163)
Other current assets ................................................... 11 11 154
Accounts payable ..................................................... (352) (16) 65
Accrued and other liabilities .............................................. (52) (152) (68)
Income taxes, net ..................................................... (148) (95) (250)
Class action settlement liability ............................................. — (3,020) 2,992
Other ............................................................ 3 (54) 28
Net cash provided by (used in) operating activities ............................... 2,429 (872) 1,814
Net cash (used in) provided by discontinued operating activities ....................... (8) (18) 2,498
Cash Flows From Investing Activities:
Capital expenditures ...................................................... (709) (734) (666)
Proceeds from disposal of assets .............................................. 13 28 23
Accounts purchased from ADT dealer program ..................................... (543) (376) (409)
Acquisition of businesses, net of cash acquired ...................................... (48) (347) (31)
Divestiture of businesses, net of cash retained ...................................... 2 1 8
Class action settlement escrow ................................................ — 2,960 (2,960)
Liquidation of rabbi trust investments ........................................... — — 271
Decrease in investments ................................................... 17 32 4
(Increase) decrease in restricted cash ............................................ — (17) 5
Other .............................................................. (1) (1) 15
Net cash (used in) provided by investing activities ................................ (1,269) 1,546 (3,740)
Net cash provided by (used in) discontinued investing activities ........................ 66 911 (810)
Cash Flows From Financing Activities:
Proceeds from issuance of short-term debt ........................................ 26 16 1,517
Repayment of short-term debt ................................................ (552) (377) (1,151)
Proceeds from issuance of long-term debt ......................................... 3,424 3,864 308
Repayment of long-term debt, including debt tenders .................................. (2,890) (4,050) (6,602)
Proceeds from exercise of share options .......................................... 1 49 406
Dividends paid ......................................................... (388) (292) (791)
Repurchase of common shares by subsidiary ....................................... (3) (854) (727)
Repurchase of common shares held in treasury ...................................... — (192) —
Transfer from discontinued operations ........................................... 58 897 8,585
Other .............................................................. 9 (72) 12
Net cash (used in) provided by financing activities ................................ (315) (1,011) 1,557
Net cash used in discontinued financing activities ................................ (58) (893) (950)
Effect of currency translation on cash ........................................... (10) (38) 70
Effect of currency translation on cash related to discontinued operations ...................... — — 33
Net increase (decrease) in cash and cash equivalents .................................. 835 (375) 472
Less: net increase in cash related to discontinued operations ............................. — — (771)
Cash and cash equivalents at beginning of year ..................................... 1,519 1,894 2,193
Cash and cash equivalents at end of year ......................................... $2,354 $ 1,519 $ 1,894
Supplementary Cash Flow Information:
Interest paid .......................................................... $ 294 $ 313 $ 317
Income taxes paid, net of refunds .............................................. $ 291 $ 501 $ 649
Supplementary Non-Cash Financing Activities:
Conversion of debt to common shares ........................................... $ — $ 10 $ 3
See Notes to Consolidated Financial Statements.
2009 Financials 87