ADT 2009 Annual Report Download - page 62
Download and view the complete annual report
Please find page 62 of the 2009 ADT annual report below. You can navigate through the pages in the report by either clicking on the pages listed below, or by using the keyword search tool below to find specific information within the annual report.-
 1
1 -
2
-
3
-
4
-
5
-
6
-
7
-
8
-
9
-
10
-
11
-
12
-
13
-
14
-
15
-
16
-
17
-
18
-
19
-
20
-
21
-
22
-
23
-
24
-
25
-
26
-
27
-
28
-
29
-
30
-
31
-
32
-
33
-
34
-
35
-
36
-
37
-
38
-
39
-
40
-
41
-
42
-
43
-
44
-
45
-
46
-
47
-
48
-
49
-
50
-
51
-
 52
52 -
 53
53 -
 54
54 -
 55
55 -
 56
56 -
 57
57 -
 58
58 -
 59
59 -
 60
60 -
 61
61 -
 62
62 -
 63
63 -
 64
64 -
 65
65 -
 66
66 -
 67
67 -
 68
68 -
 69
69 -
 70
70 -
 71
71 -
 72
72 -
73
-
74
-
75
-
76
-
77
-
78
-
79
-
80
-
81
-
82
-
83
-
84
-
85
-
86
-
87
-
88
-
89
-
90
-
91
-
92
-
93
-
94
-
95
-
96
-
97
-
98
-
99
-
100
-
101
-
102
-
103
-
104
-
105
-
106
-
107
-
108
-
109
-
110
-
111
-
112
-
113
-
114
-
115
-
116
-
117
-
118
-
119
-
120
-
121
-
122
-
123
-
124
-
125
-
126
-
127
-
128
-
129
-
130
-
131
-
132
-
133
-
134
-
135
-
136
-
137
-
138
-
139
-
140
-
141
-
142
-
143
-
144
-
145
-
146
-
147
-
148
-
149
-
150
-
151
-
152
-
153
-
154
-
155
-
156
-
157
-
158
-
159
-
160
-
161
-
162
-
163
-
164
-
165
-
166
-
167
-
168
-
169
-
170
-
171
-
172
-
173
-
174
-
175
-
176
-
177
-
178
-
179
-
180
-
181
-
182
-
183
-
184
-
185
-
186
-
187
-
188
-
189
-
190
-
191
-
192
-
193
-
194
-
195
-
196
-
197
-
198
-
199
-
200
-
201
-
202
-
203
-
204
-
205
-
206
-
207
-
208
-
209
-
210
-
211
-
212
-
213
-
214
-
215
-
216
-
217
-
218
-
219
-
220
-
221
-
222
-
223
-
224
-
225
-
226
-
227
-
228
-
229
-
230
-
231
-
232
-
233
-
234
-
235
-
236
-
237
-
238
-
239
-
240
-
241
-
242
-
243
-
244
-
245
-
246
-
247
-
248
-
249
-
250
-
251
-
252
-
253
-
254
-
255
-
256
-
257
-
258
-
259
-
260
-
261
-
262
-
263
-
264
-
265
-
266
-
267
-
268
-
269
-
270
-
271
-
272
-
273
-
274
-
275
-
276
-
277
-
278
-
279
-
280
-
281
-
282
-
283
-
284
-
285
-
286
-
287
-
288
-
289
-
290
 |
 |

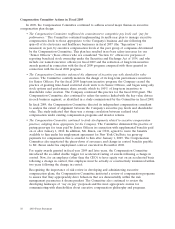
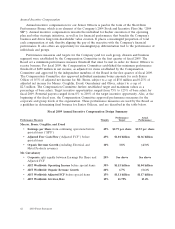
Annual Incentive Compensation
Annual incentive compensation for our Senior Officers is paid in the form of the Short-Term
Performance Bonus, which is an element of the Company’s 2004 Stock and Incentive Plan (the ‘‘2004
SIP’’). Annual incentive compensation rewards the individual for his/her execution of the operating
plan and other strategic initiatives, as well as for financial performance that benefits the Company’s
business and drives long-term shareholder value creation. It places a meaningful proportion of total
cash compensation at risk, thereby aligning the pay of the executive with the Company’s financial
performance. It also offers an opportunity for meaningful pay differentiation tied to the performance of
individuals and groups.
Performance measures and targets for the Company (and for each group, division and business
segment) were established by the Compensation Committee in the first quarter of fiscal 2009. The
Board set a minimum performance measure threshold that must be met in order for Senior Officers to
receive bonuses. For fiscal 2009, the Compensation Committee established the minimum performance
threshold of $450 million in net income, as adjusted for items established by the Compensation
Committee and approved by the independent members of the Board in the first quarter of fiscal 2009.
The Compensation Committee also approved individual maximum bonus amounts for each Senior
Officer of 0.5% of adjusted net income for Mr. Breen, subject to a cap of $5.0 million and 0.25% of
adjusted net income for Messrs. Coughlin, Evard, Gursahaney and Oliver, subject to a cap of
$2.5 million. The Compensation Committee further established target and maximum values as a
percentage of base salary. Target incentive opportunities ranged from 75% to 125% of base salary for
fiscal 2009. Potential payouts ranged from 0% to 200% of the target incentive opportunity. Also, at the
beginning of the fiscal year, the Compensation Committee approved performance measures for the
corporate and group levels of the organization. These performance measures are used by the Board as
a guideline in determining final bonuses for Senior Officers, and are described in the table below.
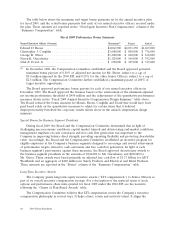
Fiscal 2009 Annual Incentive Compensation Design Summary
Performance Actual
Performance Measure Weights Target Performance
Messrs. Breen, Coughlin, and Evard
•Earnings per Share from continuing operations before 45% $2.79 per share $2.53 per share
special items (‘‘EPS’’)
•Adjusted Free Cash Flow (‘‘Adjusted FCF’’) before 45% $1.01 billion $1.36 billion
special items
•Organic Revenue Growth (excluding Electrical and 10% 3.8% (4.3)%
Metal Products revenue)
Mr. Gursahaney
•Corporate split equally between Earnings Per Share and 20% See above See above
Adjusted FCF
•ADT Worldwide Operating Income before special items 30% $1.15 billion $1.04 billion
•ADT Worldwide Organic Revenue Growth 20% 1.7% (3.1)%
•ADT Worldwide Adjusted FCF before special items 15% $1.11 billion $1.17 billion
•ADT Worldwide Attrition Rate 15% 11.79% 13.4%
42 2010 Proxy Statement