ADT 2009 Annual Report Download - page 130
Download and view the complete annual report
Please find page 130 of the 2009 ADT annual report below. You can navigate through the pages in the report by either clicking on the pages listed below, or by using the keyword search tool below to find specific information within the annual report.-
 1
1 -
2
-
3
-
4
-
5
-
6
-
7
-
8
-
9
-
10
-
11
-
12
-
13
-
14
-
15
-
16
-
17
-
18
-
19
-
20
-
21
-
22
-
23
-
24
-
25
-
26
-
27
-
28
-
29
-
30
-
31
-
32
-
33
-
34
-
35
-
36
-
37
-
38
-
39
-
40
-
41
-
42
-
43
-
44
-
45
-
46
-
47
-
48
-
49
-
50
-
51
-
52
-
53
-
54
-
55
-
56
-
57
-
58
-
59
-
60
-
61
-
62
-
63
-
64
-
65
-
66
-
67
-
68
-
69
-
70
-
71
-
72
-
73
-
74
-
75
-
76
-
77
-
78
-
79
-
80
-
81
-
82
-
83
-
84
-
85
-
86
-
87
-
88
-
89
-
90
-
91
-
92
-
93
-
94
-
95
-
96
-
97
-
98
-
99
-
100
-
101
-
102
-
103
-
104
-
105
-
106
-
107
-
108
-
109
-
110
-
111
-
112
-
113
-
114
-
115
-
116
-
117
-
118
-
119
-
 120
120 -
 121
121 -
 122
122 -
 123
123 -
 124
124 -
 125
125 -
 126
126 -
 127
127 -
 128
128 -
 129
129 -
 130
130 -
 131
131 -
 132
132 -
 133
133 -
 134
134 -
 135
135 -
 136
136 -
 137
137 -
 138
138 -
 139
139 -
 140
140 -
141
-
142
-
143
-
144
-
145
-
146
-
147
-
148
-
149
-
150
-
151
-
152
-
153
-
154
-
155
-
156
-
157
-
158
-
159
-
160
-
161
-
162
-
163
-
164
-
165
-
166
-
167
-
168
-
169
-
170
-
171
-
172
-
173
-
174
-
175
-
176
-
177
-
178
-
179
-
180
-
181
-
182
-
183
-
184
-
185
-
186
-
187
-
188
-
189
-
190
-
191
-
192
-
193
-
194
-
195
-
196
-
197
-
198
-
199
-
200
-
201
-
202
-
203
-
204
-
205
-
206
-
207
-
208
-
209
-
210
-
211
-
212
-
213
-
214
-
215
-
216
-
217
-
218
-
219
-
220
-
221
-
222
-
223
-
224
-
225
-
226
-
227
-
228
-
229
-
230
-
231
-
232
-
233
-
234
-
235
-
236
-
237
-
238
-
239
-
240
-
241
-
242
-
243
-
244
-
245
-
246
-
247
-
248
-
249
-
250
-
251
-
252
-
253
-
254
-
255
-
256
-
257
-
258
-
259
-
260
-
261
-
262
-
263
-
264
-
265
-
266
-
267
-
268
-
269
-
270
-
271
-
272
-
273
-
274
-
275
-
276
-
277
-
278
-
279
-
280
-
281
-
282
-
283
-
284
-
285
-
286
-
287
-
288
-
289
-
290
 |
 |

Operating income decreased $3.4 billion to an operating loss of $1.5 billion for 2009. The
operating loss included an aggregate goodwill impairment charge of $2.6 billion relating to reporting
units in our Electrical and Metal Products, ADT Worldwide, Fire Protection Services and Safety
Products segments and intangible asset impairment charges of $64 million relating to assets at our ADT
Worldwide and Safety Products segments for 2009. Additionally, lower volumes primarily in our
Electrical and Metal Products and Safety Products segments negatively impacted operating income. In
addition, 2009 included legacy legal settlement charges of $125 million as well as restructuring, asset
impairment and divestiture charges, net of $251 million. Operating income for 2008 included
Separation related costs of $4 million, restructuring, asset impairment and divestiture charges, net of
$247 million and a legacy settlement charge of $29 million, offset by a credit of $10 million for class
action settlement recoveries. Changes in foreign currency exchange rates negatively affected operating
income by $61 million for 2009.
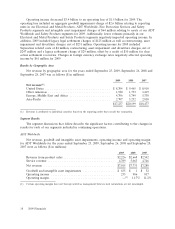
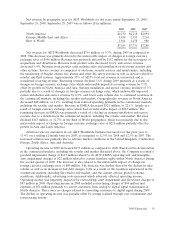
Results by Geographic Area
Net revenue by geographic area for the years ended September 25, 2009, September 26, 2008 and
September 28, 2007 was as follows ($ in millions):
2009 2008 2007
Net revenue(1):
United States ..................................... $ 8,304 $ 9,465 $ 8,910
Other Americas ................................... 1,520 1,733 1,419
Europe, Middle East and Africa ....................... 4,706 5,749 5,338
Asia-Pacific ...................................... 2,707 3,252 2,810
$17,237 $20,199 $18,477
(1) Revenue is attributed to individual countries based on the reporting entity that records the transaction.
Segment Results
The segment discussions that follow describe the significant factors contributing to the changes in
results for each of our segments included in continuing operations.
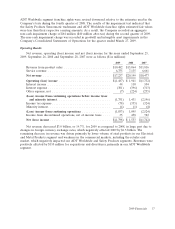
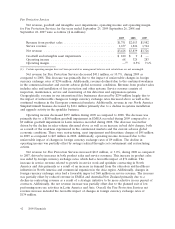
ADT Worldwide
Net revenue, goodwill and intangible asset impairments, operating income and operating margin
for ADT Worldwide for the years ended September 25, 2009, September 26, 2008 and September 28,
2007 were as follows ($ in millions):
2009 2008 2007
Revenue from product sales ............................. $2,226 $2,668 $2,542
Service revenue ...................................... 4,789 5,063 4,746
Net revenue ........................................ $7,015 $7,731 $7,288
Goodwill and intangible asset impairments .................. $ 635 $ 1 $ 52
Operating income .................................... 233 906 817
Operating margin ..................................... —
(1) 11.7% 11.2%
(1) Certain operating margins have not been presented as management believes such calculations are not meaningful.
38 2009 Financials