ADT 2009 Annual Report Download - page 63
Download and view the complete annual report
Please find page 63 of the 2009 ADT annual report below. You can navigate through the pages in the report by either clicking on the pages listed below, or by using the keyword search tool below to find specific information within the annual report.-
 1
1 -
2
-
3
-
4
-
5
-
6
-
7
-
8
-
9
-
10
-
11
-
12
-
13
-
14
-
15
-
16
-
17
-
18
-
19
-
20
-
21
-
22
-
23
-
24
-
25
-
26
-
27
-
28
-
29
-
30
-
31
-
32
-
33
-
34
-
35
-
36
-
37
-
38
-
39
-
40
-
41
-
42
-
43
-
44
-
45
-
46
-
47
-
48
-
49
-
50
-
51
-
52
-
 53
53 -
 54
54 -
 55
55 -
 56
56 -
 57
57 -
 58
58 -
 59
59 -
 60
60 -
 61
61 -
 62
62 -
 63
63 -
 64
64 -
 65
65 -
 66
66 -
 67
67 -
 68
68 -
 69
69 -
 70
70 -
 71
71 -
 72
72 -
 73
73 -
74
-
75
-
76
-
77
-
78
-
79
-
80
-
81
-
82
-
83
-
84
-
85
-
86
-
87
-
88
-
89
-
90
-
91
-
92
-
93
-
94
-
95
-
96
-
97
-
98
-
99
-
100
-
101
-
102
-
103
-
104
-
105
-
106
-
107
-
108
-
109
-
110
-
111
-
112
-
113
-
114
-
115
-
116
-
117
-
118
-
119
-
120
-
121
-
122
-
123
-
124
-
125
-
126
-
127
-
128
-
129
-
130
-
131
-
132
-
133
-
134
-
135
-
136
-
137
-
138
-
139
-
140
-
141
-
142
-
143
-
144
-
145
-
146
-
147
-
148
-
149
-
150
-
151
-
152
-
153
-
154
-
155
-
156
-
157
-
158
-
159
-
160
-
161
-
162
-
163
-
164
-
165
-
166
-
167
-
168
-
169
-
170
-
171
-
172
-
173
-
174
-
175
-
176
-
177
-
178
-
179
-
180
-
181
-
182
-
183
-
184
-
185
-
186
-
187
-
188
-
189
-
190
-
191
-
192
-
193
-
194
-
195
-
196
-
197
-
198
-
199
-
200
-
201
-
202
-
203
-
204
-
205
-
206
-
207
-
208
-
209
-
210
-
211
-
212
-
213
-
214
-
215
-
216
-
217
-
218
-
219
-
220
-
221
-
222
-
223
-
224
-
225
-
226
-
227
-
228
-
229
-
230
-
231
-
232
-
233
-
234
-
235
-
236
-
237
-
238
-
239
-
240
-
241
-
242
-
243
-
244
-
245
-
246
-
247
-
248
-
249
-
250
-
251
-
252
-
253
-
254
-
255
-
256
-
257
-
258
-
259
-
260
-
261
-
262
-
263
-
264
-
265
-
266
-
267
-
268
-
269
-
270
-
271
-
272
-
273
-
274
-
275
-
276
-
277
-
278
-
279
-
280
-
281
-
282
-
283
-
284
-
285
-
286
-
287
-
288
-
289
-
290
 |
 |

Performance Actual
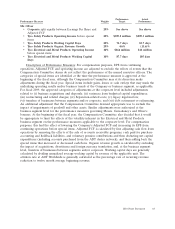
Performance Measure Weights Target Performance
Mr. Oliver
•Corporate split equally between Earnings Per Share and 20% See above See above
Adjusted FCF
•Tyco Safety Products Operating Income before special 20% $309.5 million $209.3 million
items
•Tyco Safety Products Working Capital Days 20% 74.7 days 83.7 days
•Tyco Safety Products Organic Revenue Growth 20% 4.6% (13.6)%
•Tyco Electrical and Metal Products Operating Income 10% $166 million $11 million
before special items
•Tyco Electrical and Metal Products Working Capital 10% 87.7 days 105 days
Days
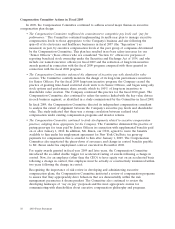
Description of Performance Measures: For compensation purposes, EPS from continuing
operations, Adjusted FCF, and operating income are adjusted to exclude the effects of events that the
Compensation Committee deems do not reflect the performance of the named executive officers. The
categories of special items are identified at the time the performance measure is approved at the
beginning of the fiscal year, although the Compensation Committee may at its discretion make
adjustments during the fiscal year. Special items include gains, losses or cash outlays that may mask the
underlying operating results and/or business trends of the Company or business segment, as applicable.
For fiscal 2009, the approved categories of adjustments at the corporate level included adjustments
related to (i) business acquisitions and disposals; (ii) variances from budgeted capital expenditures;
(iii) restructuring and related charges; (iv) Separation-related costs; (v) legacy legal matters;
(vi) transfers of businesses between segments and/or corporate; and (vii) debt retirement or refinancing.
An additional adjustment that the Compensation Committee deemed appropriate was to exclude the
impact of impairments of goodwill and other assets. Similar adjustments were authorized at the
business segment level for the performance measures governing Messrs. Gursahaney’s and Oliver’s
bonuses. At the beginning of the fiscal year, the Compensation Committee also decided that it would
be appropriate to limit the effects of the volatility inherent in the Electrical and Metal Products
business segment on the performance measures applicable to the corporate level. For compensation
purposes, this had the effect of lowering the Company’s Adjusted FCF and increasing its EPS from
continuing operations before special items. Adjusted FCF is calculated by first adjusting cash flow from
operations by removing the effects of the sale of accounts receivable programs, cash paid for purchase
accounting and holdback liabilities, and voluntary pension contributions and then deducting net capital
expenditures (including accounts purchased from the ADT dealer network), and then adding back the
special items that increased or decreased cash flows. Organic revenue growth is calculated by excluding
the impact of acquisitions, divestitures and foreign currency translation, and, at the business segment
level, transfers of businesses between segments and/or corporate. Working capital days are generally
calculated by dividing annualized average working capital by revenue of the applicable unit. The
attrition rate at ADT Worldwide is generally calculated as the percentage rate of recurring revenue
reduction to twelve month average beginning revenue.
2010 Proxy Statement 43