ADT 2009 Annual Report Download - page 201
Download and view the complete annual report
Please find page 201 of the 2009 ADT annual report below. You can navigate through the pages in the report by either clicking on the pages listed below, or by using the keyword search tool below to find specific information within the annual report.-
 1
1 -
2
-
3
-
4
-
5
-
6
-
7
-
8
-
9
-
10
-
11
-
12
-
13
-
14
-
15
-
16
-
17
-
18
-
19
-
20
-
21
-
22
-
23
-
24
-
25
-
26
-
27
-
28
-
29
-
30
-
31
-
32
-
33
-
34
-
35
-
36
-
37
-
38
-
39
-
40
-
41
-
42
-
43
-
44
-
45
-
46
-
47
-
48
-
49
-
50
-
51
-
52
-
53
-
54
-
55
-
56
-
57
-
58
-
59
-
60
-
61
-
62
-
63
-
64
-
65
-
66
-
67
-
68
-
69
-
70
-
71
-
72
-
73
-
74
-
75
-
76
-
77
-
78
-
79
-
80
-
81
-
82
-
83
-
84
-
85
-
86
-
87
-
88
-
89
-
90
-
91
-
92
-
93
-
94
-
95
-
96
-
97
-
98
-
99
-
100
-
101
-
102
-
103
-
104
-
105
-
106
-
107
-
108
-
109
-
110
-
111
-
112
-
113
-
114
-
115
-
116
-
117
-
118
-
119
-
120
-
121
-
122
-
123
-
124
-
125
-
126
-
127
-
128
-
129
-
130
-
131
-
132
-
133
-
134
-
135
-
136
-
137
-
138
-
139
-
140
-
141
-
142
-
143
-
144
-
145
-
146
-
147
-
148
-
149
-
150
-
151
-
152
-
153
-
154
-
155
-
156
-
157
-
158
-
159
-
160
-
161
-
162
-
163
-
164
-
165
-
166
-
167
-
168
-
169
-
170
-
171
-
172
-
173
-
174
-
175
-
176
-
177
-
178
-
179
-
180
-
181
-
182
-
183
-
184
-
185
-
186
-
187
-
188
-
189
-
190
-
 191
191 -
 192
192 -
 193
193 -
 194
194 -
 195
195 -
 196
196 -
 197
197 -
 198
198 -
 199
199 -
 200
200 -
 201
201 -
 202
202 -
 203
203 -
 204
204 -
 205
205 -
 206
206 -
 207
207 -
 208
208 -
 209
209 -
 210
210 -
 211
211 -
212
-
213
-
214
-
215
-
216
-
217
-
218
-
219
-
220
-
221
-
222
-
223
-
224
-
225
-
226
-
227
-
228
-
229
-
230
-
231
-
232
-
233
-
234
-
235
-
236
-
237
-
238
-
239
-
240
-
241
-
242
-
243
-
244
-
245
-
246
-
247
-
248
-
249
-
250
-
251
-
252
-
253
-
254
-
255
-
256
-
257
-
258
-
259
-
260
-
261
-
262
-
263
-
264
-
265
-
266
-
267
-
268
-
269
-
270
-
271
-
272
-
273
-
274
-
275
-
276
-
277
-
278
-
279
-
280
-
281
-
282
-
283
-
284
-
285
-
286
-
287
-
288
-
289
-
290
 |
 |

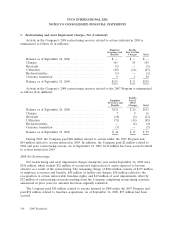
TYCO INTERNATIONAL LTD.
NOTES TO CONSOLIDATED FINANCIAL STATEMENTS
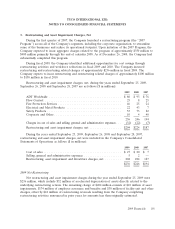
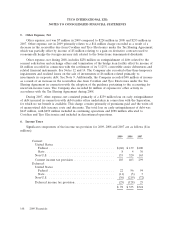
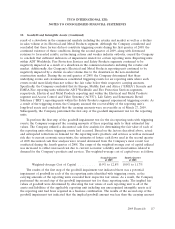
6. Income Taxes (Continued)
Non-U.S. income (loss) from continuing operations before income taxes was $138 million,
$1,010 million and $(2,587) million for 2009, 2008 and 2007, respectively.
The reconciliation between U.S. federal income taxes at the statutory rate and the Company’s
provision for income taxes on continuing operations for the years ended September 25, 2009,
September 26, 2008, and September 28, 2007 is as follows ($ in millions):
2009 2008 2007
Notional U.S. federal income tax (benefit) expense at the
statutory rate ................................. $(613) $ 501 $ (769)
Adjustments to reconcile to the income tax provision:
U.S. state income tax provision, net ................ 18 34 23
Non-U.S. net earnings(1) ......................... (279) (240) (58)
Nondeductible charges .......................... 885 46 1,176
Valuation allowance ............................ 9 (70) (129)
Non-deductible loss on retirement of debt ............ — — 91
Other ...................................... 58 64 (10)
Provision for income taxes ....................... $ 78 $335 $ 324
(1) Excludes nondeductible charges and other items which are broken out separately in the table.
Included in the nondeductible charges for 2009 is the loss driven by the goodwill impairment
charges of $2.6 billion, for which almost no tax benefit is available.
Included in income taxes for 2008 is a benefit from increased profitability in operations in lower
tax rate jurisdictions partially offset by enacted tax law changes that negatively impacted non-U.S.
deferred tax assets. The valuation allowance benefit includes a tax impact of $70 million associated with
business restructurings, which increased the Company’s profitability in certain jurisdictions.
Included in the nondeductible charges for 2007 is the class action settlement, net of $2.862 billion.
Additionally, the nondeductible charges include $105 million associated with Separation costs which
were not fully deductible as well as a write-off of deferred tax assets in entities that were liquidated as
part of the Separation. The loss on retirement of debt includes charges related to the early
extinguishment of debt of $259 million for which no tax benefit is available. The valuation allowance
benefit includes a tax impact of $72 million associated with identification of tax planning to ensure
realization of certain deferred tax assets as well as a net benefit of $51 million associated with changes
in valuation allowances driven primarily by increased profitability in certain jurisdictions.
2009 Financials 109