ADT 2009 Annual Report Download - page 134
Download and view the complete annual report
Please find page 134 of the 2009 ADT annual report below. You can navigate through the pages in the report by either clicking on the pages listed below, or by using the keyword search tool below to find specific information within the annual report.-
 1
1 -
2
-
3
-
4
-
5
-
6
-
7
-
8
-
9
-
10
-
11
-
12
-
13
-
14
-
15
-
16
-
17
-
18
-
19
-
20
-
21
-
22
-
23
-
24
-
25
-
26
-
27
-
28
-
29
-
30
-
31
-
32
-
33
-
34
-
35
-
36
-
37
-
38
-
39
-
40
-
41
-
42
-
43
-
44
-
45
-
46
-
47
-
48
-
49
-
50
-
51
-
52
-
53
-
54
-
55
-
56
-
57
-
58
-
59
-
60
-
61
-
62
-
63
-
64
-
65
-
66
-
67
-
68
-
69
-
70
-
71
-
72
-
73
-
74
-
75
-
76
-
77
-
78
-
79
-
80
-
81
-
82
-
83
-
84
-
85
-
86
-
87
-
88
-
89
-
90
-
91
-
92
-
93
-
94
-
95
-
96
-
97
-
98
-
99
-
100
-
101
-
102
-
103
-
104
-
105
-
106
-
107
-
108
-
109
-
110
-
111
-
112
-
113
-
114
-
115
-
116
-
117
-
118
-
119
-
120
-
121
-
122
-
123
-
 124
124 -
 125
125 -
 126
126 -
 127
127 -
 128
128 -
 129
129 -
 130
130 -
 131
131 -
 132
132 -
 133
133 -
 134
134 -
 135
135 -
 136
136 -
 137
137 -
 138
138 -
 139
139 -
 140
140 -
 141
141 -
 142
142 -
 143
143 -
 144
144 -
145
-
146
-
147
-
148
-
149
-
150
-
151
-
152
-
153
-
154
-
155
-
156
-
157
-
158
-
159
-
160
-
161
-
162
-
163
-
164
-
165
-
166
-
167
-
168
-
169
-
170
-
171
-
172
-
173
-
174
-
175
-
176
-
177
-
178
-
179
-
180
-
181
-
182
-
183
-
184
-
185
-
186
-
187
-
188
-
189
-
190
-
191
-
192
-
193
-
194
-
195
-
196
-
197
-
198
-
199
-
200
-
201
-
202
-
203
-
204
-
205
-
206
-
207
-
208
-
209
-
210
-
211
-
212
-
213
-
214
-
215
-
216
-
217
-
218
-
219
-
220
-
221
-
222
-
223
-
224
-
225
-
226
-
227
-
228
-
229
-
230
-
231
-
232
-
233
-
234
-
235
-
236
-
237
-
238
-
239
-
240
-
241
-
242
-
243
-
244
-
245
-
246
-
247
-
248
-
249
-
250
-
251
-
252
-
253
-
254
-
255
-
256
-
257
-
258
-
259
-
260
-
261
-
262
-
263
-
264
-
265
-
266
-
267
-
268
-
269
-
270
-
271
-
272
-
273
-
274
-
275
-
276
-
277
-
278
-
279
-
280
-
281
-
282
-
283
-
284
-
285
-
286
-
287
-
288
-
289
-
290
 |
 |

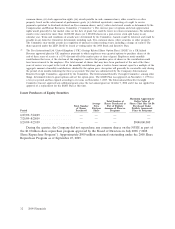
Fire Protection Services
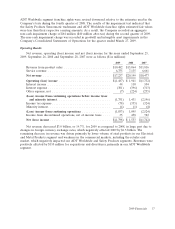
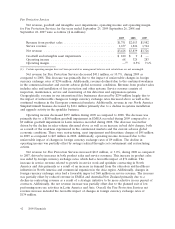
Net revenue, goodwill and intangible asset impairments, operating income and operating margin
for Fire Protection Services for the years ended September 25, 2009 September 26, 2008 and
September 28, 2007 were as follows ($ in millions):
2009 2008 2007
Revenue from product sales ............................. $1,751 $2,013 $1,982
Service revenue ...................................... 1,677 1,826 1,744
Net revenue ........................................ $3,428 $3,839 $3,726
Goodwill and intangible asset impairments .................. $ 180 $ 9 $ —
Operating income .................................... 68 325 283
Operating margin ..................................... —
(1) 8.5% 7.6%
(1) Certain operating margins have not been presented as management believes such calculations are not meaningful.
Net revenue for Fire Protection Services decreased $411 million, or 10.7%, during 2009 as
compared to 2008. This decrease was primarily due to the impact of unfavorable changes in foreign
currency exchange rates of $294 million. Additionally, revenue declined due to the continued weakness
in the commercial market and current adverse global economic conditions. Revenue from product sales
includes sales and installation of fire protection and other systems. Service revenue consists of
inspection, maintenance, service and monitoring of fire detection and suppression systems.
Geographically, revenue in our international fire businesses decreased by $294 million largely due to
the impact of unfavorable changes in foreign currency exchange rates discussed above as well as the
continued weakness in the European commercial markets. Additionally, revenue in our North America
SimplexGrinnell business decreased by $116 million primarily due to a decline in systems installation
and upgrade activity in the sprinkler business.
Operating income decreased $257 million during 2009 as compared to 2008. The decrease was
primarily due to a $180 million goodwill impairment in EMEA recorded during 2009 compared to a
$9 million goodwill impairment in Latin America recorded during 2008. The decrease was further
driven by the decline in sales volume discussed above as well as an increase in bad debt charges, both
as a result of the weakness experienced in the commercial markets and the current adverse global
economic conditions. There were restructuring, asset impairment and divestiture charges of $45 million
in 2009 as compared to $25 million in 2008. Additionally, operating income decreased due to the
unfavorable impact of changes in foreign currency exchange rates of $9 million. The decline in
operating income was partially offset by savings realized through cost containment and restructuring
actions.
Net revenue for Fire Protection Services increased $113 million, or 3.0%, during 2008 as compared
to 2007, driven by increases in both product sales and service revenues. This increase in product sales
was aided by foreign currency exchange rates, which had a favorable impact of $74 million. The
increase in service revenue related to growth in service work and sprinkler contracting in North
America and Asia primarily as a result of an increase in demand from the education and healthcare
industries in North America and commercial expansion in the Asia region. Additionally, changes in
foreign currency exchange rates had a favorable impact of $60 million on service revenue. The increase
was partially offset by reduced revenue in EMEA and Australia/New Zealand primarily due to a
decline in contracting revenue as a result of a strategic initiative to be more selective in our pursuit of
contracts. Additionally, the net revenue increase was partially offset due to the planned exit of low
performing non-core activities in Latin America and Asia. Overall, the Fire Protection Services net
revenue increase included the favorable impact of changes in foreign currency exchange rates of
$134 million.
42 2009 Financials