ADT 2009 Annual Report Download - page 131
Download and view the complete annual report
Please find page 131 of the 2009 ADT annual report below. You can navigate through the pages in the report by either clicking on the pages listed below, or by using the keyword search tool below to find specific information within the annual report.-
 1
1 -
2
-
3
-
4
-
5
-
6
-
7
-
8
-
9
-
10
-
11
-
12
-
13
-
14
-
15
-
16
-
17
-
18
-
19
-
20
-
21
-
22
-
23
-
24
-
25
-
26
-
27
-
28
-
29
-
30
-
31
-
32
-
33
-
34
-
35
-
36
-
37
-
38
-
39
-
40
-
41
-
42
-
43
-
44
-
45
-
46
-
47
-
48
-
49
-
50
-
51
-
52
-
53
-
54
-
55
-
56
-
57
-
58
-
59
-
60
-
61
-
62
-
63
-
64
-
65
-
66
-
67
-
68
-
69
-
70
-
71
-
72
-
73
-
74
-
75
-
76
-
77
-
78
-
79
-
80
-
81
-
82
-
83
-
84
-
85
-
86
-
87
-
88
-
89
-
90
-
91
-
92
-
93
-
94
-
95
-
96
-
97
-
98
-
99
-
100
-
101
-
102
-
103
-
104
-
105
-
106
-
107
-
108
-
109
-
110
-
111
-
112
-
113
-
114
-
115
-
116
-
117
-
118
-
119
-
120
-
 121
121 -
 122
122 -
 123
123 -
 124
124 -
 125
125 -
 126
126 -
 127
127 -
 128
128 -
 129
129 -
 130
130 -
 131
131 -
 132
132 -
 133
133 -
 134
134 -
 135
135 -
 136
136 -
 137
137 -
 138
138 -
 139
139 -
 140
140 -
 141
141 -
142
-
143
-
144
-
145
-
146
-
147
-
148
-
149
-
150
-
151
-
152
-
153
-
154
-
155
-
156
-
157
-
158
-
159
-
160
-
161
-
162
-
163
-
164
-
165
-
166
-
167
-
168
-
169
-
170
-
171
-
172
-
173
-
174
-
175
-
176
-
177
-
178
-
179
-
180
-
181
-
182
-
183
-
184
-
185
-
186
-
187
-
188
-
189
-
190
-
191
-
192
-
193
-
194
-
195
-
196
-
197
-
198
-
199
-
200
-
201
-
202
-
203
-
204
-
205
-
206
-
207
-
208
-
209
-
210
-
211
-
212
-
213
-
214
-
215
-
216
-
217
-
218
-
219
-
220
-
221
-
222
-
223
-
224
-
225
-
226
-
227
-
228
-
229
-
230
-
231
-
232
-
233
-
234
-
235
-
236
-
237
-
238
-
239
-
240
-
241
-
242
-
243
-
244
-
245
-
246
-
247
-
248
-
249
-
250
-
251
-
252
-
253
-
254
-
255
-
256
-
257
-
258
-
259
-
260
-
261
-
262
-
263
-
264
-
265
-
266
-
267
-
268
-
269
-
270
-
271
-
272
-
273
-
274
-
275
-
276
-
277
-
278
-
279
-
280
-
281
-
282
-
283
-
284
-
285
-
286
-
287
-
288
-
289
-
290
 |
 |

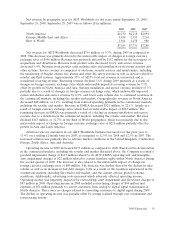
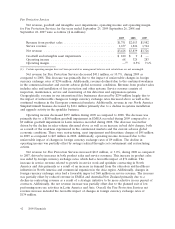
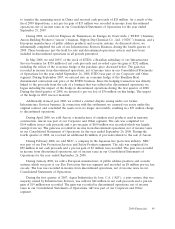
Net revenue by geographic area for ADT Worldwide for the years ended September 25, 2009,
September 26, 2008, September 28, 2007 was as follows ($ in millions):
2009 2008 2007
North America ...................................... $4,170 $4,218 $4,094
Europe, Middle East and Africa .......................... 1,834 2,355 2,214
Rest of World ....................................... 1,011 1,158 980
$7,015 $7,731 $7,288
Net revenue for ADT Worldwide decreased $716 million, or 9.3%, during 2009 as compared to
2008. This decrease was primarily driven by the unfavorable impact of changes in foreign currency
exchange rates of $590 million. Revenue was positively affected by $152 million for the net impact of
acquisitions and divestitures. Revenue from product sales decreased 16.6% and service revenue
decreased 5.4%. Revenue from product sales includes sales and installation of electronic security and
other systems. Service revenue is comprised of electronic security services and maintenance, including
the monitoring of burglar alarms, fire alarms and other life safety systems as well as services related to
retailer anti-theft systems. Approximately 55% of ADT’s total net revenue is contractual and is
considered recurring revenue. Recurring revenue declined 3.6% during 2009 primarily as a result of
changes in foreign currency exchange rates which unfavorably impacted recurring revenue by 7.5%
offset by growth in North America and Asia. Systems installation and service revenue declined 15.3%
partially due to a result of changes in foreign currency exchange rates, which unfavorably impacted
system installation and service revenue by 8.3%, and lower sales volume due to continued weakness in
the commercial markets, including the retailer end market. Geographically, revenue in North America
decreased $48 million, or 1.1%, resulting from reduced spending primarily in the commercial markets,
including the retailer end market. Revenue in EMEA decreased $521 million, or 22.1%, largely as a
result of foreign currency exchange rates, which had an unfavorable impact of $323 million. The
remaining decrease in EMEA was primarily a result of a decline in systems installation and service
revenue due to a slowdown in the commercial markets, including the retailer end market. Revenue
declined $147 million, or 12.7%, in the Rest of World geographies, which was primarily due to the
unfavorable impact of changes in foreign currency exchange rates of $219 million partially offset by
growth in Asia and Latin America.
Attrition rates for customers in our ADT Worldwide business increased over the prior year to
13.4% on a trailing 12-month basis for 2009, as compared to 12.9% for 2008 and 12.3% in 2007. The
increased attrition was primarily due to adverse market conditions in the United Kingdom, Continental
Europe, South Africa, Asia and Australia.
Operating income in 2009 decreased $673 million as compared to 2008. Based on the deterioration
in the commercial markets, including the retailer end market discussed above, the Company recorded a
goodwill impairment charge of $613 million related to its ADT EMEA reporting unit and intangible
asset impairment charges of $22 million related to certain franchise rights within North America during
the second quarter of 2009. The decrease is also related to the unfavorable impact of changes in
foreign currency exchange rates of $44 million. The decrease was further driven by the decline in sales
volume as well as an increase in bad debt charges, both as a result of the weakness experienced in the
commercial markets, including the retailer end market, and the current adverse global economic
conditions. Additionally, advertising costs increased which adversely affected operating income.
Operating income was negatively impacted by restructuring, asset impairment and divestiture charges of
$87 million in 2009. Operating income in 2008 included restructuring charges of $94 million and
expenses of $51 million primarily to convert customers from analog to digital signal transmission in
North America. There were no charges related to converting customers to digital signal during 2009.
The decline in operating income was partially offset by savings realized through cost containment and
restructuring actions.
2009 Financials 39