ADT 2009 Annual Report Download - page 207
Download and view the complete annual report
Please find page 207 of the 2009 ADT annual report below. You can navigate through the pages in the report by either clicking on the pages listed below, or by using the keyword search tool below to find specific information within the annual report.-
 1
1 -
2
-
3
-
4
-
5
-
6
-
7
-
8
-
9
-
10
-
11
-
12
-
13
-
14
-
15
-
16
-
17
-
18
-
19
-
20
-
21
-
22
-
23
-
24
-
25
-
26
-
27
-
28
-
29
-
30
-
31
-
32
-
33
-
34
-
35
-
36
-
37
-
38
-
39
-
40
-
41
-
42
-
43
-
44
-
45
-
46
-
47
-
48
-
49
-
50
-
51
-
52
-
53
-
54
-
55
-
56
-
57
-
58
-
59
-
60
-
61
-
62
-
63
-
64
-
65
-
66
-
67
-
68
-
69
-
70
-
71
-
72
-
73
-
74
-
75
-
76
-
77
-
78
-
79
-
80
-
81
-
82
-
83
-
84
-
85
-
86
-
87
-
88
-
89
-
90
-
91
-
92
-
93
-
94
-
95
-
96
-
97
-
98
-
99
-
100
-
101
-
102
-
103
-
104
-
105
-
106
-
107
-
108
-
109
-
110
-
111
-
112
-
113
-
114
-
115
-
116
-
117
-
118
-
119
-
120
-
121
-
122
-
123
-
124
-
125
-
126
-
127
-
128
-
129
-
130
-
131
-
132
-
133
-
134
-
135
-
136
-
137
-
138
-
139
-
140
-
141
-
142
-
143
-
144
-
145
-
146
-
147
-
148
-
149
-
150
-
151
-
152
-
153
-
154
-
155
-
156
-
157
-
158
-
159
-
160
-
161
-
162
-
163
-
164
-
165
-
166
-
167
-
168
-
169
-
170
-
171
-
172
-
173
-
174
-
175
-
176
-
177
-
178
-
179
-
180
-
181
-
182
-
183
-
184
-
185
-
186
-
187
-
188
-
189
-
190
-
191
-
192
-
193
-
194
-
195
-
196
-
 197
197 -
 198
198 -
 199
199 -
 200
200 -
 201
201 -
 202
202 -
 203
203 -
 204
204 -
 205
205 -
 206
206 -
 207
207 -
 208
208 -
 209
209 -
 210
210 -
 211
211 -
 212
212 -
 213
213 -
 214
214 -
 215
215 -
 216
216 -
 217
217 -
218
-
219
-
220
-
221
-
222
-
223
-
224
-
225
-
226
-
227
-
228
-
229
-
230
-
231
-
232
-
233
-
234
-
235
-
236
-
237
-
238
-
239
-
240
-
241
-
242
-
243
-
244
-
245
-
246
-
247
-
248
-
249
-
250
-
251
-
252
-
253
-
254
-
255
-
256
-
257
-
258
-
259
-
260
-
261
-
262
-
263
-
264
-
265
-
266
-
267
-
268
-
269
-
270
-
271
-
272
-
273
-
274
-
275
-
276
-
277
-
278
-
279
-
280
-
281
-
282
-
283
-
284
-
285
-
286
-
287
-
288
-
289
-
290
 |
 |

TYCO INTERNATIONAL LTD.
NOTES TO CONSOLIDATED FINANCIAL STATEMENTS
7. Earnings Per Share (Continued)
The computation of diluted earnings per share for 2009 excludes the effect of the potential
exercise of options to purchase approximately 27 million shares and excludes restricted share awards
and deferred stock units of approximately 5 million shares because the effect would be anti-dilutive.
The computation of diluted earnings per share for 2008 and 2007 excludes the effect of the
potential exercise of options to purchase approximately 19 million and 29 million shares, respectively,
and excludes restricted share awards and deferred stock units of approximately 4 million and 5 million,
respectively, because the effect would be anti-dilutive. Additionally, the computation of diluted earnings
per common share for 2007 excludes the impact of convertible debt of approximately 6 million shares
because the effect would be anti-dilutive.
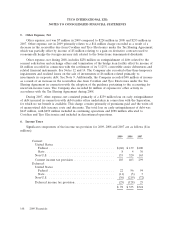
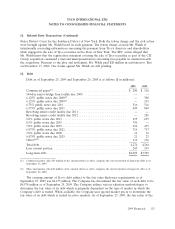
8. Sale of Accounts Receivable
Certain of Tyco’s international businesses utilize the sale of accounts receivable as short-term
financing mechanisms. The aggregate amount outstanding under the Company’s remaining international
accounts receivable programs was $55 million, $65 million and $76 million as of September 25, 2009,
September 26, 2008 and September 28, 2007, respectively.
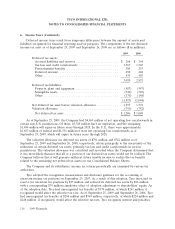
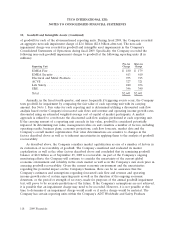
9. Investments
As of September 25, 2009 and September 26, 2008, the Company had available-for-sale
investments with a fair value of $340 million and $303 million, and a cost basis of $334 million and
$317 million, respectively.
The cost and fair market value of the Company’s investments by type of security and classification
in the Company’s Consolidated Balance Sheets are as follows ($ in millions):
As of September 25, 2009:
Consolidated
Balance Sheet
Classification
Prepaid
expenses
Other- and
Gross Gross Than- Other
Cost Unrealized Unrealized Temporary Fair Current Other
Type of Security Basis Gain Loss Impairment Value Assets Assets
Corporate debt securities ............... $103 $ 4 $ (1) $ — $106 $ 36 $ 70
U.S. Government debt securities .......... 228 3 — — 231 13 218
Other debt securities .................. 3 — — — 3 — 3
$334 $ 7 $ (1) $ — $340 $ 49 $291
2009 Financials 115