ADT 2009 Annual Report Download - page 253
Download and view the complete annual report
Please find page 253 of the 2009 ADT annual report below. You can navigate through the pages in the report by either clicking on the pages listed below, or by using the keyword search tool below to find specific information within the annual report.-
 1
1 -
2
-
3
-
4
-
5
-
6
-
7
-
8
-
9
-
10
-
11
-
12
-
13
-
14
-
15
-
16
-
17
-
18
-
19
-
20
-
21
-
22
-
23
-
24
-
25
-
26
-
27
-
28
-
29
-
30
-
31
-
32
-
33
-
34
-
35
-
36
-
37
-
38
-
39
-
40
-
41
-
42
-
43
-
44
-
45
-
46
-
47
-
48
-
49
-
50
-
51
-
52
-
53
-
54
-
55
-
56
-
57
-
58
-
59
-
60
-
61
-
62
-
63
-
64
-
65
-
66
-
67
-
68
-
69
-
70
-
71
-
72
-
73
-
74
-
75
-
76
-
77
-
78
-
79
-
80
-
81
-
82
-
83
-
84
-
85
-
86
-
87
-
88
-
89
-
90
-
91
-
92
-
93
-
94
-
95
-
96
-
97
-
98
-
99
-
100
-
101
-
102
-
103
-
104
-
105
-
106
-
107
-
108
-
109
-
110
-
111
-
112
-
113
-
114
-
115
-
116
-
117
-
118
-
119
-
120
-
121
-
122
-
123
-
124
-
125
-
126
-
127
-
128
-
129
-
130
-
131
-
132
-
133
-
134
-
135
-
136
-
137
-
138
-
139
-
140
-
141
-
142
-
143
-
144
-
145
-
146
-
147
-
148
-
149
-
150
-
151
-
152
-
153
-
154
-
155
-
156
-
157
-
158
-
159
-
160
-
161
-
162
-
163
-
164
-
165
-
166
-
167
-
168
-
169
-
170
-
171
-
172
-
173
-
174
-
175
-
176
-
177
-
178
-
179
-
180
-
181
-
182
-
183
-
184
-
185
-
186
-
187
-
188
-
189
-
190
-
191
-
192
-
193
-
194
-
195
-
196
-
197
-
198
-
199
-
200
-
201
-
202
-
203
-
204
-
205
-
206
-
207
-
208
-
209
-
210
-
211
-
212
-
213
-
214
-
215
-
216
-
217
-
218
-
219
-
220
-
221
-
222
-
223
-
224
-
225
-
226
-
227
-
228
-
229
-
230
-
231
-
232
-
233
-
234
-
235
-
236
-
237
-
238
-
239
-
240
-
241
-
242
-
 243
243 -
 244
244 -
 245
245 -
 246
246 -
 247
247 -
 248
248 -
 249
249 -
 250
250 -
 251
251 -
 252
252 -
 253
253 -
 254
254 -
 255
255 -
 256
256 -
 257
257 -
 258
258 -
 259
259 -
 260
260 -
 261
261 -
 262
262 -
 263
263 -
264
-
265
-
266
-
267
-
268
-
269
-
270
-
271
-
272
-
273
-
274
-
275
-
276
-
277
-
278
-
279
-
280
-
281
-
282
-
283
-
284
-
285
-
286
-
287
-
288
-
289
-
290
 |
 |

TYCO INTERNATIONAL LTD.
NOTES TO CONSOLIDATED FINANCIAL STATEMENTS
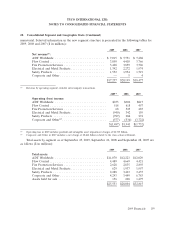
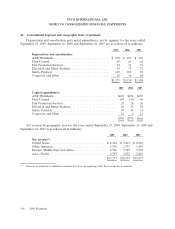
20. Consolidated Segment and Geographic Data (Continued)
Long-lived assets by geographic area as of September 25, 2009, September 26, 2008 and
September 28, 2007 are as follows ($ in millions):
2009 2008 2007
Long-lived assets(1):
United States ................................. $2,701 $2,722 $2,681
Other Americas ............................... 402 364 339
Europe, Middle East and Africa ................... 539 566 577
Asia—Pacific ................................. 605 582 526
Corporate and Other ........................... 14 14 117
$4,261 $4,248 $4,240
(1) Long-lived assets are comprised primarily of property, plant and equipment and exclude goodwill, other intangible assets,
deferred taxes and other shared assets.
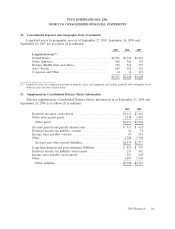
21. Supplementary Consolidated Balance Sheets Information
Selected supplementary Consolidated Balance Sheets information as of September 25, 2009 and
September 26, 2008 is as follows ($ in millions):
2009 2008
Deferred tax asset—non-current .......................... $1,113 $1,101
Other non-current assets ............................... 1,538 1,481
Other assets ....................................... $2,651 $2,582
Accrued payroll and payroll related costs ................... $ 555 $ 627
Deferred income tax liability—current ...................... 46 51
Income taxes payable—current ........................... 87 241
Other ............................................. 1,788 1,798
Accrued and other current liabilities ..................... $2,476 $2,717
Long-term pension and postretirement liabilities .............. $ 825 $ 559
Deferred income tax liability—non-current .................. 273 542
Income taxes payable—non-current ........................ 221 249
Other ............................................. 1,401 1,365
Other liabilities .................................... $2,720 $2,715
2009 Financials 161