ADT 2009 Annual Report Download - page 248
Download and view the complete annual report
Please find page 248 of the 2009 ADT annual report below. You can navigate through the pages in the report by either clicking on the pages listed below, or by using the keyword search tool below to find specific information within the annual report.-
 1
1 -
2
-
3
-
4
-
5
-
6
-
7
-
8
-
9
-
10
-
11
-
12
-
13
-
14
-
15
-
16
-
17
-
18
-
19
-
20
-
21
-
22
-
23
-
24
-
25
-
26
-
27
-
28
-
29
-
30
-
31
-
32
-
33
-
34
-
35
-
36
-
37
-
38
-
39
-
40
-
41
-
42
-
43
-
44
-
45
-
46
-
47
-
48
-
49
-
50
-
51
-
52
-
53
-
54
-
55
-
56
-
57
-
58
-
59
-
60
-
61
-
62
-
63
-
64
-
65
-
66
-
67
-
68
-
69
-
70
-
71
-
72
-
73
-
74
-
75
-
76
-
77
-
78
-
79
-
80
-
81
-
82
-
83
-
84
-
85
-
86
-
87
-
88
-
89
-
90
-
91
-
92
-
93
-
94
-
95
-
96
-
97
-
98
-
99
-
100
-
101
-
102
-
103
-
104
-
105
-
106
-
107
-
108
-
109
-
110
-
111
-
112
-
113
-
114
-
115
-
116
-
117
-
118
-
119
-
120
-
121
-
122
-
123
-
124
-
125
-
126
-
127
-
128
-
129
-
130
-
131
-
132
-
133
-
134
-
135
-
136
-
137
-
138
-
139
-
140
-
141
-
142
-
143
-
144
-
145
-
146
-
147
-
148
-
149
-
150
-
151
-
152
-
153
-
154
-
155
-
156
-
157
-
158
-
159
-
160
-
161
-
162
-
163
-
164
-
165
-
166
-
167
-
168
-
169
-
170
-
171
-
172
-
173
-
174
-
175
-
176
-
177
-
178
-
179
-
180
-
181
-
182
-
183
-
184
-
185
-
186
-
187
-
188
-
189
-
190
-
191
-
192
-
193
-
194
-
195
-
196
-
197
-
198
-
199
-
200
-
201
-
202
-
203
-
204
-
205
-
206
-
207
-
208
-
209
-
210
-
211
-
212
-
213
-
214
-
215
-
216
-
217
-
218
-
219
-
220
-
221
-
222
-
223
-
224
-
225
-
226
-
227
-
228
-
229
-
230
-
231
-
232
-
233
-
234
-
235
-
236
-
237
-
 238
238 -
 239
239 -
 240
240 -
 241
241 -
 242
242 -
 243
243 -
 244
244 -
 245
245 -
 246
246 -
 247
247 -
 248
248 -
 249
249 -
 250
250 -
 251
251 -
 252
252 -
 253
253 -
 254
254 -
 255
255 -
 256
256 -
 257
257 -
 258
258 -
259
-
260
-
261
-
262
-
263
-
264
-
265
-
266
-
267
-
268
-
269
-
270
-
271
-
272
-
273
-
274
-
275
-
276
-
277
-
278
-
279
-
280
-
281
-
282
-
283
-
284
-
285
-
286
-
287
-
288
-
289
-
290
 |
 |

TYCO INTERNATIONAL LTD.
NOTES TO CONSOLIDATED FINANCIAL STATEMENTS
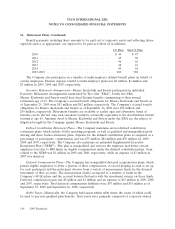
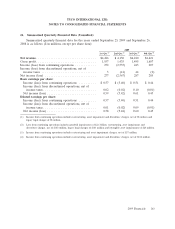
18. Share Plans (Continued)
Recipients of restricted shares have the right to vote such shares and receive dividends, whereas
recipients of restricted stock units have no voting rights and receive dividend equivalents. Recipients of
performance shares have no voting rights and do not receive dividend equivalents.
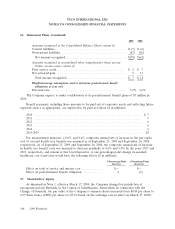
A summary of the status of the Company’s restricted share awards including performance shares as
of September 25, 2009 and changes during the year then ended is presented in the tables below:
Weighted-Average
Grant-Date
Non-vested Restricted Share Awards Shares Fair Value
Non-vested as of September 26, 2008 ........................... 3,502,246 $49.06
Granted ................................................ 2,105,903 28.56
Vested ................................................. (1,574,864) 48.20
Forfeited ................................................ (296,575) 41.69
Non-vested as of September 25, 2009 ........................... 3,736,710 38.75
The weighted-average grant-date fair value of restricted share awards granted during 2009, 2008
and 2007 was $28.56, $40.27 and $49.49, respectively. The total fair value of restricted share awards
vested during 2009, 2008 and 2007 was $74 million, $41 million and $58 million, respectively.
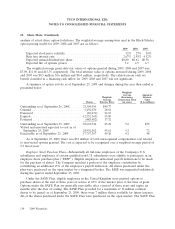
Weighted-Average
Grant-Date
Non-vested Performance Share Awards Shares Fair Value
Non-vested as of September 26, 2008 ............................ 483,050 $61.78
Granted ................................................. 998,500 27.84
Forfeited ................................................ (64,027) 43.16
Non-vested as of September 25, 2009 ............................ 1,417,523 38.71
The weighted-average grant-date fair value of performance share awards granted during 2009, 2008
and 2007 was $27.84, $46.11 and $59.49, respectively. The total fair value of performance shares vested
during 2007 was $1 million. There were no performance shares which vested during 2009 and 2008.
As of September 25, 2009, there was $96 million of total unrecognized compensation cost related
to both non-vested restricted share awards and performance shares. That cost is expected to be
recognized over a weighted-average period of 2.1 fiscal years.
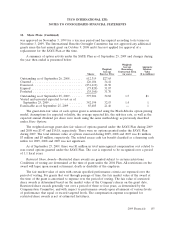
Deferred Stock Units—Deferred Stock Units (‘‘DSUs’’) are notional units that are tied to the value
of Tyco common shares with distribution deferred until termination of employment. Distribution, when
made, will be in the form of actual shares. Similar to restricted share grants that vest through the
passage of time, the fair value of DSUs is determined based on the market value of the Company’s
shares on the grant date and is amortized to expense over the vesting period. Recipients of DSUs do
not have the right to vote such shares and do not have the right to receive cash dividends. However,
they have the right to receive dividend equivalents. Conditions of vesting are determined at the time of
grant. Under the 2004 Plan, the majority of Tyco’s DSU grants vest in equal annual installments over
three years. The Company has granted 1 million DSUs, the majority of which were outstanding as of
September 25, 2009.
156 2009 Financials