ADT 2009 Annual Report Download - page 64
Download and view the complete annual report
Please find page 64 of the 2009 ADT annual report below. You can navigate through the pages in the report by either clicking on the pages listed below, or by using the keyword search tool below to find specific information within the annual report.-
 1
1 -
2
-
3
-
4
-
5
-
6
-
7
-
8
-
9
-
10
-
11
-
12
-
13
-
14
-
15
-
16
-
17
-
18
-
19
-
20
-
21
-
22
-
23
-
24
-
25
-
26
-
27
-
28
-
29
-
30
-
31
-
32
-
33
-
34
-
35
-
36
-
37
-
38
-
39
-
40
-
41
-
42
-
43
-
44
-
45
-
46
-
47
-
48
-
49
-
50
-
51
-
52
-
53
-
 54
54 -
 55
55 -
 56
56 -
 57
57 -
 58
58 -
 59
59 -
 60
60 -
 61
61 -
 62
62 -
 63
63 -
 64
64 -
 65
65 -
 66
66 -
 67
67 -
 68
68 -
 69
69 -
 70
70 -
 71
71 -
 72
72 -
 73
73 -
 74
74 -
75
-
76
-
77
-
78
-
79
-
80
-
81
-
82
-
83
-
84
-
85
-
86
-
87
-
88
-
89
-
90
-
91
-
92
-
93
-
94
-
95
-
96
-
97
-
98
-
99
-
100
-
101
-
102
-
103
-
104
-
105
-
106
-
107
-
108
-
109
-
110
-
111
-
112
-
113
-
114
-
115
-
116
-
117
-
118
-
119
-
120
-
121
-
122
-
123
-
124
-
125
-
126
-
127
-
128
-
129
-
130
-
131
-
132
-
133
-
134
-
135
-
136
-
137
-
138
-
139
-
140
-
141
-
142
-
143
-
144
-
145
-
146
-
147
-
148
-
149
-
150
-
151
-
152
-
153
-
154
-
155
-
156
-
157
-
158
-
159
-
160
-
161
-
162
-
163
-
164
-
165
-
166
-
167
-
168
-
169
-
170
-
171
-
172
-
173
-
174
-
175
-
176
-
177
-
178
-
179
-
180
-
181
-
182
-
183
-
184
-
185
-
186
-
187
-
188
-
189
-
190
-
191
-
192
-
193
-
194
-
195
-
196
-
197
-
198
-
199
-
200
-
201
-
202
-
203
-
204
-
205
-
206
-
207
-
208
-
209
-
210
-
211
-
212
-
213
-
214
-
215
-
216
-
217
-
218
-
219
-
220
-
221
-
222
-
223
-
224
-
225
-
226
-
227
-
228
-
229
-
230
-
231
-
232
-
233
-
234
-
235
-
236
-
237
-
238
-
239
-
240
-
241
-
242
-
243
-
244
-
245
-
246
-
247
-
248
-
249
-
250
-
251
-
252
-
253
-
254
-
255
-
256
-
257
-
258
-
259
-
260
-
261
-
262
-
263
-
264
-
265
-
266
-
267
-
268
-
269
-
270
-
271
-
272
-
273
-
274
-
275
-
276
-
277
-
278
-
279
-
280
-
281
-
282
-
283
-
284
-
285
-
286
-
287
-
288
-
289
-
290
 |
 |

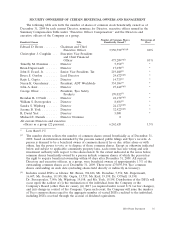
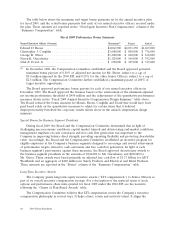
The table below shows the maximum and target bonus payments set by the annual incentive plan
for fiscal 2009, and the actual bonus payments that each of our named executive officers received under
the plan. These amounts are reported in the ‘‘Non-Equity Incentive Plan Compensation’’ column of the
‘‘Summary Compensation’’ table.
Fiscal 2009 Performance Bonus Summary
Named Executive Officer (Current) Maximum(1) Target Actual
Edward D. Breen .................................. $4,062,500 $2,031,250 $1,869,000
Christopher J. Coughlin .............................. $1,600,000 $ 800,000 $ 736,000
George R. Oliver .................................. $1,200,000 $ 600,000 $ 168,000
Naren K. Gursahaney ............................... $1,120,000 $ 560,000 $ 392,000
John E. Evard, Jr. ................................. $ 690,000 $ 345,000 $ 317,000
(1) In December 2008, the Compensation Committee established and the Board approved potential
maximum bonus payouts of 0.50% of adjusted net income for Mr. Breen, subject to a cap of
$5.0 million imposed by the 2004 SIP, and 0.25% for the other Senior Officers, subject to a cap of
$2.5 million. The Compensation Committee further established a maximum payout of 200% of
target incentive opportunity.
The Board approved performance bonus payouts for each of our named executive officers in
December 2009. The Board approved the bonuses based on the achievement of the minimum adjusted
net income performance threshold of $450 million and the achievement of the quantitative performance
measures shown in the ‘‘Fiscal 2009 Annual Incentive Compensation Design Summary’’ table above.
The Board reduced the bonus amounts for Messrs. Breen, Coughlin and Evard that would have been
paid based solely on the quantitative measures to adjust for certain items that it believed
disproportionately benefited the corporate results shown above in the annual compensation design
summary.
Special Bonus for Business Segment Presidents
During fiscal 2009, the Board and the Compensation Committee determined that in light of
challenging macroeconomic conditions, capital market turmoil and deteriorating end-market conditions,
management emphasis on cash conversion and free cash flow generation was important to the
Company in improving balance sheet strength, providing operating flexibility and protecting shareholder
value. Accordingly, the Board and the Compensation Committee established an incentive program for
eligible employees at the Company’s business segments designed to encourage and reward achievement
of performance targets related to cash conversion and free cash flow generation. In light of each
business segment’s performance against these measures, the Board approved discretionary awards to
the business segment presidents in the amounts of $146,000 to Mr. Gursahaney and $282,000 to
Mr. Oliver. These awards were based primarily on adjusted free cash flow of $1.17 billion for ADT
Worldwide and an aggregate of $400 million for Safety Products and Electrical and Metal Products.
These amounts are reported in the ‘‘Bonus’’ column of the ‘‘Summary Compensation’’ table.
Long-Term Incentive Awards
The Company grants long-term equity incentive awards (‘‘LTI compensation’’) to Senior Officers as
part of its overall executive compensation strategy. For a description of the material terms of stock
options and performance share units granted for fiscal 2009 under the 2004 SIP, see the narrative
following the ‘‘Grants of Plan-Based Awards’’ table.
The Compensation Committee believes that LTI compensation serves the Company’s executive
compensation philosophy in several ways. It helps attract, retain and motivate talent. It aligns the
44 2010 Proxy Statement