ADT 2009 Annual Report Download - page 132
Download and view the complete annual report
Please find page 132 of the 2009 ADT annual report below. You can navigate through the pages in the report by either clicking on the pages listed below, or by using the keyword search tool below to find specific information within the annual report.-
 1
1 -
2
-
3
-
4
-
5
-
6
-
7
-
8
-
9
-
10
-
11
-
12
-
13
-
14
-
15
-
16
-
17
-
18
-
19
-
20
-
21
-
22
-
23
-
24
-
25
-
26
-
27
-
28
-
29
-
30
-
31
-
32
-
33
-
34
-
35
-
36
-
37
-
38
-
39
-
40
-
41
-
42
-
43
-
44
-
45
-
46
-
47
-
48
-
49
-
50
-
51
-
52
-
53
-
54
-
55
-
56
-
57
-
58
-
59
-
60
-
61
-
62
-
63
-
64
-
65
-
66
-
67
-
68
-
69
-
70
-
71
-
72
-
73
-
74
-
75
-
76
-
77
-
78
-
79
-
80
-
81
-
82
-
83
-
84
-
85
-
86
-
87
-
88
-
89
-
90
-
91
-
92
-
93
-
94
-
95
-
96
-
97
-
98
-
99
-
100
-
101
-
102
-
103
-
104
-
105
-
106
-
107
-
108
-
109
-
110
-
111
-
112
-
113
-
114
-
115
-
116
-
117
-
118
-
119
-
120
-
121
-
 122
122 -
 123
123 -
 124
124 -
 125
125 -
 126
126 -
 127
127 -
 128
128 -
 129
129 -
 130
130 -
 131
131 -
 132
132 -
 133
133 -
 134
134 -
 135
135 -
 136
136 -
 137
137 -
 138
138 -
 139
139 -
 140
140 -
 141
141 -
 142
142 -
143
-
144
-
145
-
146
-
147
-
148
-
149
-
150
-
151
-
152
-
153
-
154
-
155
-
156
-
157
-
158
-
159
-
160
-
161
-
162
-
163
-
164
-
165
-
166
-
167
-
168
-
169
-
170
-
171
-
172
-
173
-
174
-
175
-
176
-
177
-
178
-
179
-
180
-
181
-
182
-
183
-
184
-
185
-
186
-
187
-
188
-
189
-
190
-
191
-
192
-
193
-
194
-
195
-
196
-
197
-
198
-
199
-
200
-
201
-
202
-
203
-
204
-
205
-
206
-
207
-
208
-
209
-
210
-
211
-
212
-
213
-
214
-
215
-
216
-
217
-
218
-
219
-
220
-
221
-
222
-
223
-
224
-
225
-
226
-
227
-
228
-
229
-
230
-
231
-
232
-
233
-
234
-
235
-
236
-
237
-
238
-
239
-
240
-
241
-
242
-
243
-
244
-
245
-
246
-
247
-
248
-
249
-
250
-
251
-
252
-
253
-
254
-
255
-
256
-
257
-
258
-
259
-
260
-
261
-
262
-
263
-
264
-
265
-
266
-
267
-
268
-
269
-
270
-
271
-
272
-
273
-
274
-
275
-
276
-
277
-
278
-
279
-
280
-
281
-
282
-
283
-
284
-
285
-
286
-
287
-
288
-
289
-
290
 |
 |
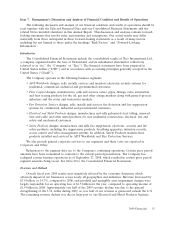
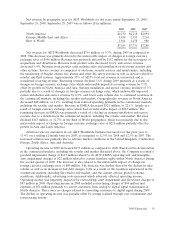
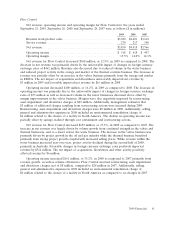
Net revenue for ADT Worldwide increased $443 million, or 6.1%, during 2008, with product
revenue up 5.0% and service revenue up 6.7%, as compared to 2007. Approximately 50% of ADT’s
total net revenue is contractual and is considered recurring revenue. Overall, recurring revenue grew
7.2% during 2008 while systems installation and service revenue grew 4.9%. Geographically, North
America grew 3%, resulting largely from growth in recurring revenue which was partially offset by
weakness in the retailer end market. The North America net revenue increase also includes the impact
of acquisitions, which contributed $53 million. The year-over-year net revenue increase in North
America was partially offset by weakness in the retailer end market during the fourth quarter of 2008.
Revenue in the EMEA region increased $141 million, or 6.4%, as a result of foreign currency exchange
rates which had a favorable impact of $142 million. This increase was partially offset by a decline in
systems installation and service revenue due to weakness in the retailer end market as well as
commercial softness primarily in the United Kingdom. The 18.2% revenue growth in the Rest of World
geographies was primarily driven by growth in both recurring revenue and contracting across all
regions. The Rest of the World increase included the favorable impact of changes in foreign currency
exchange rates of $30 million. Overall, the ADT Worldwide net revenue increase included the favorable
impact of changes in foreign currency exchange rates of $204 million. The net impact of acquisitions,
divestitures, and other activity positively affected revenue by $27 million.
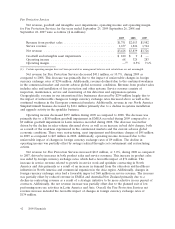
Operating margin in ADT Worldwide increased to 11.7% in 2008 from 11.2% in 2007. North
America is one of the most profitable geographic areas for ADT Worldwide with 2008 and 2007
operating margin of 15.8% and 16.9%, respectively. Margins in North America were negatively
impacted by $57 million of restructuring and asset impairments in 2008 compared to $6 million in 2007.
Restructuring charges in 2008 include $58 million relating to the reacquisition of certain franchise
rights that were deemed to be unfavorable to the Company. There were no charges related to the
reacquisition of franchise rights in 2007. In addition, North America incurred $48 million and
$12 million to convert customers from analog to digital signal transmissions in 2008 and 2007,
respectively. North America operating margins benefited from growth in recurring revenue partially
offset by declines in the retailer end market. ADT EMEA had 2008 and 2007 operating margin of
5.0% and 2.5%, respectively. EMEA’s operating income included $34 million of restructuring and
impairments in 2008 compared with $67 million in 2007. EMEA margins benefited from reduced costs
as a result of the restructuring program, which was partially offset by volume decreases as discussed
above.
Operating income in 2008 increased $89 million, or 10.9%, as compared to 2007. Factors that
positively impacted operating income included increased volume, particularly our higher margin
recurring revenue, operational efficiencies, including those achieved from restructuring activities in
Europe, lower depreciation and amortization expense and lower long-lived asset impairment charges.
The decrease in depreciation and amortization expense occurred primarily in North America and
resulted from changes to the depreciation method and estimated useful lives for pooled subscriber
assets and changes to the estimated useful lives of dealer intangible assets. The reduction in
depreciation and amortization expense was partially offset by increased net expenses of $51 million,
which primarily related to converting customers from analog to digital signal transmissions in North
America. Results for 2007 include goodwill impairment charges due to the reorganization of our
management and segment reporting structure following the Separation.
40 2009 Financials