ADT 2009 Annual Report Download - page 82
Download and view the complete annual report
Please find page 82 of the 2009 ADT annual report below. You can navigate through the pages in the report by either clicking on the pages listed below, or by using the keyword search tool below to find specific information within the annual report.-
 1
1 -
2
-
3
-
4
-
5
-
6
-
7
-
8
-
9
-
10
-
11
-
12
-
13
-
14
-
15
-
16
-
17
-
18
-
19
-
20
-
21
-
22
-
23
-
24
-
25
-
26
-
27
-
28
-
29
-
30
-
31
-
32
-
33
-
34
-
35
-
36
-
37
-
38
-
39
-
40
-
41
-
42
-
43
-
44
-
45
-
46
-
47
-
48
-
49
-
50
-
51
-
52
-
53
-
54
-
55
-
56
-
57
-
58
-
59
-
60
-
61
-
62
-
63
-
64
-
65
-
66
-
67
-
68
-
69
-
70
-
71
-
 72
72 -
 73
73 -
 74
74 -
 75
75 -
 76
76 -
 77
77 -
 78
78 -
 79
79 -
 80
80 -
 81
81 -
 82
82 -
 83
83 -
 84
84 -
 85
85 -
 86
86 -
 87
87 -
 88
88 -
 89
89 -
 90
90 -
 91
91 -
 92
92 -
93
-
94
-
95
-
96
-
97
-
98
-
99
-
100
-
101
-
102
-
103
-
104
-
105
-
106
-
107
-
108
-
109
-
110
-
111
-
112
-
113
-
114
-
115
-
116
-
117
-
118
-
119
-
120
-
121
-
122
-
123
-
124
-
125
-
126
-
127
-
128
-
129
-
130
-
131
-
132
-
133
-
134
-
135
-
136
-
137
-
138
-
139
-
140
-
141
-
142
-
143
-
144
-
145
-
146
-
147
-
148
-
149
-
150
-
151
-
152
-
153
-
154
-
155
-
156
-
157
-
158
-
159
-
160
-
161
-
162
-
163
-
164
-
165
-
166
-
167
-
168
-
169
-
170
-
171
-
172
-
173
-
174
-
175
-
176
-
177
-
178
-
179
-
180
-
181
-
182
-
183
-
184
-
185
-
186
-
187
-
188
-
189
-
190
-
191
-
192
-
193
-
194
-
195
-
196
-
197
-
198
-
199
-
200
-
201
-
202
-
203
-
204
-
205
-
206
-
207
-
208
-
209
-
210
-
211
-
212
-
213
-
214
-
215
-
216
-
217
-
218
-
219
-
220
-
221
-
222
-
223
-
224
-
225
-
226
-
227
-
228
-
229
-
230
-
231
-
232
-
233
-
234
-
235
-
236
-
237
-
238
-
239
-
240
-
241
-
242
-
243
-
244
-
245
-
246
-
247
-
248
-
249
-
250
-
251
-
252
-
253
-
254
-
255
-
256
-
257
-
258
-
259
-
260
-
261
-
262
-
263
-
264
-
265
-
266
-
267
-
268
-
269
-
270
-
271
-
272
-
273
-
274
-
275
-
276
-
277
-
278
-
279
-
280
-
281
-
282
-
283
-
284
-
285
-
286
-
287
-
288
-
289
-
290
 |
 |

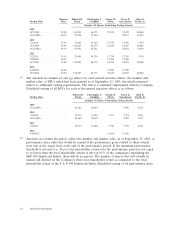
Exercise Edward D. Christopher J. George R. Naren K. John E.
Vesting Date Price Breen Coughlin Oliver Gursahaney Evard, Jr.
Number Of Shares Underlying Vesting Awards
2009
10/7/2009 .......... 29.00 138,525 46,175 32,325 32,325 20,000
11/21/2009 ......... 48.14 99,928 47,210 22,031 12,589
2010
7/2/2010 ........... 53.36 73,000 34,750 17,750 17,750 9,750
10/7/2010 .......... 29.00 138,525 46,175 32,325 32,325 20,000
11/21/2010 ......... 48.14 99,929 47,211 22,032 12,590
2011
7/2/2011 ........... 53.36 73,000 34,750 17,750 17,750 9,750
8/18/2011 .......... 44.49 17,500 17,500
10/7/2011 .......... 29.00 138,525 46,175 32,325 32,325 20,000
2012
8/18/2012 .......... 44.49 17,500 17,500
10/7/2012 .......... 29.00 138,525 46,175 32,325 32,325 20,000
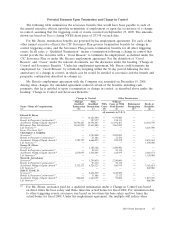
(2) The amounts in columns (f) and (g) reflect, for each named executive officer, the number and
market value of RSUs which had been granted as of September 25, 2009, but which remained
subject to additional vesting requirements. The officer’s continued employment with the Company.
Scheduled vesting of all RSUs for each of the named executive officer is as follows:
Edward D. Christopher J. George R. Naren K. John E.
Vesting Date Breen Coughlin Oliver Gursahaney Evard, Jr.
Number Of Shares Underlying Vesting Awards
2009
11/21/2009 ................. 45,465 20,847 9,980 5,765
2010
7/2/2010 ................... 32,714 15,083 7,751 7,751 4,294
11/21/2010 ................. 45,465 20,847 9,980 5,765
2011
7/2/2011 ................... 32,713 15,082 7,750 7,750 4,294
2012
8/18/2012 .................. 11,566 11,566
(3) Amounts in columns (h) and (i) reflect the number and market value, as of September 25, 2009, of
performance share units that would be earned if the performance goals related to these awards
were met at the target level at the end of the performance period. If the minimum performance
threshold is not met (i.e., Tyco’s total shareholder return over the performance period is not equal
to or better than the total shareholder return of the top 65% of the companies constituting the
S&P 500 Industrials Index), there will be no payout. The number of shares that will actually be
earned will depend on the Company’s three-year shareholder return as compared to the total
shareholder return of the S & P 500 Industrials Index. Scheduled vesting of all performance share
62 2010 Proxy Statement