ADT 2009 Annual Report Download - page 12
Download and view the complete annual report
Please find page 12 of the 2009 ADT annual report below. You can navigate through the pages in the report by either clicking on the pages listed below, or by using the keyword search tool below to find specific information within the annual report.-
 1
1 -
 2
2 -
 3
3 -
 4
4 -
 5
5 -
 6
6 -
 7
7 -
 8
8 -
 9
9 -
 10
10 -
 11
11 -
 12
12 -
 13
13 -
 14
14 -
 15
15 -
 16
16 -
 17
17 -
 18
18 -
 19
19 -
 20
20 -
 21
21 -
 22
22 -
23
-
24
-
25
-
26
-
27
-
28
-
29
-
30
-
31
-
32
-
33
-
34
-
35
-
36
-
37
-
38
-
39
-
40
-
41
-
42
-
43
-
44
-
45
-
46
-
47
-
48
-
49
-
50
-
51
-
52
-
53
-
54
-
55
-
56
-
57
-
58
-
59
-
60
-
61
-
62
-
63
-
64
-
65
-
66
-
67
-
68
-
69
-
70
-
71
-
72
-
73
-
74
-
75
-
76
-
77
-
78
-
79
-
80
-
81
-
82
-
83
-
84
-
85
-
86
-
87
-
88
-
89
-
90
-
91
-
92
-
93
-
94
-
95
-
96
-
97
-
98
-
99
-
100
-
101
-
102
-
103
-
104
-
105
-
106
-
107
-
108
-
109
-
110
-
111
-
112
-
113
-
114
-
115
-
116
-
117
-
118
-
119
-
120
-
121
-
122
-
123
-
124
-
125
-
126
-
127
-
128
-
129
-
130
-
131
-
132
-
133
-
134
-
135
-
136
-
137
-
138
-
139
-
140
-
141
-
142
-
143
-
144
-
145
-
146
-
147
-
148
-
149
-
150
-
151
-
152
-
153
-
154
-
155
-
156
-
157
-
158
-
159
-
160
-
161
-
162
-
163
-
164
-
165
-
166
-
167
-
168
-
169
-
170
-
171
-
172
-
173
-
174
-
175
-
176
-
177
-
178
-
179
-
180
-
181
-
182
-
183
-
184
-
185
-
186
-
187
-
188
-
189
-
190
-
191
-
192
-
193
-
194
-
195
-
196
-
197
-
198
-
199
-
200
-
201
-
202
-
203
-
204
-
205
-
206
-
207
-
208
-
209
-
210
-
211
-
212
-
213
-
214
-
215
-
216
-
217
-
218
-
219
-
220
-
221
-
222
-
223
-
224
-
225
-
226
-
227
-
228
-
229
-
230
-
231
-
232
-
233
-
234
-
235
-
236
-
237
-
238
-
239
-
240
-
241
-
242
-
243
-
244
-
245
-
246
-
247
-
248
-
249
-
250
-
251
-
252
-
253
-
254
-
255
-
256
-
257
-
258
-
259
-
260
-
261
-
262
-
263
-
264
-
265
-
266
-
267
-
268
-
269
-
270
-
271
-
272
-
273
-
274
-
275
-
276
-
277
-
278
-
279
-
280
-
281
-
282
-
283
-
284
-
285
-
286
-
287
-
288
-
289
-
290
 |
 |

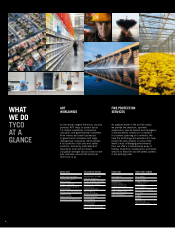
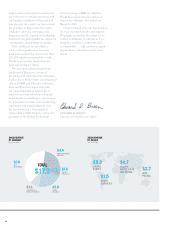
Our revenue of $17.2 billion in
2009 was impacted by the soft economy.
Organic revenue (which excludes the
impact of acquisitions, divestitures
and foreign currency) was down eight
percent, mostly due to weaker conditions
in our product businesses as well as
our systems installation activities. We
reported a net loss from continuing
operations of $1.8 billion, or $3.87 per
diluted share, which was driven by a
non-cash charge of $2.7 billion based
on a reassessment of the fair value of
the company’s goodwill and intangible
assets. Excluding special items, Tyco had
income from continuing operations of
$2.36 per share, compared to $3.06 per
share in 2008. The largest contributor
to this decline was our Electrical and
Metal Products business, which faced
historically low volumes and prices for
its products.
WHERE WE MADE PROGRESS
The many ways that everyone across
our company rose to the challenges of
2009 speak to the fundamental strengths
of Tyco and to the priority we place on
investing in our businesses. In fact, even
as the economy weakened, we remained
committed to our long-term growth
strategy and fully funded our growth
initiatives throughout the year. At the
same time, we took decisive actions to
reduce the company’s cost structure
and operating expenses. These steps —
including our restructuring activities —
generated signicant savings which helped
to offset the impact of lower revenue.
The growth of our service revenue
provided a source of stability and
consistency to our performance. Our
service activities — a large portion
of which is recurring, contractual work
for our customers — now represent
about 40 percent of our total revenue.
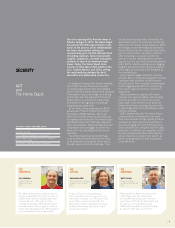
At ADT Worldwide, Tyco’s largest
business segment, recurring revenue
grew four percent organically in 2009,
and we saw growth across all geographic
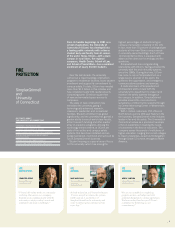
regions. Fire Protection Services also
increased the service portion of its
business to about half its total revenue.
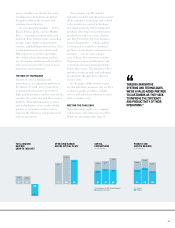
Investment in research and
development was another area of focus
for our company. We added resources
to our expanding network of 16 R&D
Centers of Excellence in North America,
Europe and Asia and began to see
that investment pay off as we launched
new products featuring state-of-the-art
technology. These innovations included
a wireless electronic security control
panel for two-way communications and
a new emergency management system
that enables site commanders to closely
monitor reghters at the scene of a re.
Our progress across a number of
areas enabled us to nish 2009 with a
stronger balance sheet than when the
year began. We actively managed our
working capital and ended the year with
$2.4 billion of cash. Our strong balance
sheet provides us with the nancial
exibility to invest in the growth of
our businesses, fund productivity
enhancements, make acquisitions, and
return capital to our shareholders.
THE GROWTH OF EMERGING MARKETS
As we look ahead, emerging markets
represent a signicant growth
opportunity for our company. These
markets generated $2.6 billion of revenue
in 2009, representing about 15 percent
of Tyco’s total revenue. Our presence
in more than 40 emerging markets has
* These are Non-GAAP Financial Measures. See GAAP reconciliations on inside back cover.
FINANCIAL HIGHLIGHTS
07 08 09
Revenue $18,477 $20,199 $17,237
(Loss) Income from Continuing Operations $( 2,524 ) $1,095 $(1,833)
Income from Continuing Operations Before Special Items* $948 $1,493 $1,122
Net (Loss) Income $( 1,742 ) $1,553 $(1,798)
Diluted (Loss) Earnings Per Share from Continuing Operations $( 5.10 ) $2.25 $(3.87)
Diluted Earnings Per Share from Continuing Operations Before Special Items* $1.89 $3.06 $2.36
Total Assets $32,815 $28,804 $25,553
Long-term Debt $4,080 $3,709 $4,029
Shareholders’ Equity $15,624 $15,494 $12,941
SELECTED FINANCIAL DATA (IN US$ MILLIONS, EXCEPT PER SHARE DATA)
10 _