ADT 2009 Annual Report Download - page 81
Download and view the complete annual report
Please find page 81 of the 2009 ADT annual report below. You can navigate through the pages in the report by either clicking on the pages listed below, or by using the keyword search tool below to find specific information within the annual report.-
 1
1 -
2
-
3
-
4
-
5
-
6
-
7
-
8
-
9
-
10
-
11
-
12
-
13
-
14
-
15
-
16
-
17
-
18
-
19
-
20
-
21
-
22
-
23
-
24
-
25
-
26
-
27
-
28
-
29
-
30
-
31
-
32
-
33
-
34
-
35
-
36
-
37
-
38
-
39
-
40
-
41
-
42
-
43
-
44
-
45
-
46
-
47
-
48
-
49
-
50
-
51
-
52
-
53
-
54
-
55
-
56
-
57
-
58
-
59
-
60
-
61
-
62
-
63
-
64
-
65
-
66
-
67
-
68
-
69
-
70
-
 71
71 -
 72
72 -
 73
73 -
 74
74 -
 75
75 -
 76
76 -
 77
77 -
 78
78 -
 79
79 -
 80
80 -
 81
81 -
 82
82 -
 83
83 -
 84
84 -
 85
85 -
 86
86 -
 87
87 -
 88
88 -
 89
89 -
 90
90 -
 91
91 -
92
-
93
-
94
-
95
-
96
-
97
-
98
-
99
-
100
-
101
-
102
-
103
-
104
-
105
-
106
-
107
-
108
-
109
-
110
-
111
-
112
-
113
-
114
-
115
-
116
-
117
-
118
-
119
-
120
-
121
-
122
-
123
-
124
-
125
-
126
-
127
-
128
-
129
-
130
-
131
-
132
-
133
-
134
-
135
-
136
-
137
-
138
-
139
-
140
-
141
-
142
-
143
-
144
-
145
-
146
-
147
-
148
-
149
-
150
-
151
-
152
-
153
-
154
-
155
-
156
-
157
-
158
-
159
-
160
-
161
-
162
-
163
-
164
-
165
-
166
-
167
-
168
-
169
-
170
-
171
-
172
-
173
-
174
-
175
-
176
-
177
-
178
-
179
-
180
-
181
-
182
-
183
-
184
-
185
-
186
-
187
-
188
-
189
-
190
-
191
-
192
-
193
-
194
-
195
-
196
-
197
-
198
-
199
-
200
-
201
-
202
-
203
-
204
-
205
-
206
-
207
-
208
-
209
-
210
-
211
-
212
-
213
-
214
-
215
-
216
-
217
-
218
-
219
-
220
-
221
-
222
-
223
-
224
-
225
-
226
-
227
-
228
-
229
-
230
-
231
-
232
-
233
-
234
-
235
-
236
-
237
-
238
-
239
-
240
-
241
-
242
-
243
-
244
-
245
-
246
-
247
-
248
-
249
-
250
-
251
-
252
-
253
-
254
-
255
-
256
-
257
-
258
-
259
-
260
-
261
-
262
-
263
-
264
-
265
-
266
-
267
-
268
-
269
-
270
-
271
-
272
-
273
-
274
-
275
-
276
-
277
-
278
-
279
-
280
-
281
-
282
-
283
-
284
-
285
-
286
-
287
-
288
-
289
-
290
 |
 |

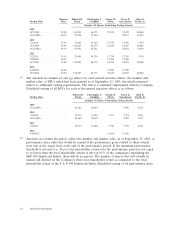
Outstanding Equity Awards at Fiscal Year-End Table
The following table shows, for each of the named executive officers, all equity awards that were
outstanding as of September 25, 2009. Dollar amounts are based on the NYSE closing price of $33.98
for the Company’s common stock on September 25, 2009.
Option Awards Stock Awards
Equity Incentive
Equity Incentive Plan Awards:
Market Plan Awards: Market or
Number of Number of Number of Value of Number of Payout Value of
Securities Securities Shares or Shares or Unearned Unearned
Underlying Underlying Units of Units of Shares, Units Shares, Units
Unexercised Unexercised Option Option Stock That Stock That or Other Rights or Other Rights
Options: (#) Options: (#) Exercise Expiration Have Not Have Not That Have Not That Have Not
Name Exercisable Unexercisable(1) Price ($) Date Vested (#)(2) Vested ($)(2) Vested (#)(3) Vested ($)(3)
(a) (b) (c) (d) (e) (f) (g) (h) (i)
Current Officers
Edward D. Breen ......... 1,828,301 — $15.89 7/24/2012 156,357 $5,313,011 248,800 $8,454,224
49,749 — $52.43 3/25/2014
49,749 — $57.19 3/25/2014
49,749 — $63.55 3/25/2014
49,749 — $58.78 3/9/2015
49,749 — $65.13 3/9/2015
49,749 — $71.49 3/9/2015
124,374 — $46.07 11/21/2015
199,857 199,857 $48.14 11/20/2016
146,000 146,000 $53.36 7/1/2017
— 554,100 $29.00 10/6/2018
Christopher J. Coughlin ..... 24,874 — $56.60 3/6/2015 71,859 $2,441,769 94,900 $3,224,702
62,187 — $56.87 3/9/2015
62,187 — $46.07 11/21/2015
94,420 94,421 $48.14 11/20/2016
69,500 69,500 $53.36 7/1/2017
— 184,700 $29.00 10/6/2018
George R. Oliver ......... 62,947 — $43.72 7/9/2016 27,067 $ 919,737 58,400 $1,984,432
35,500 35,500 $53.36 7/1/2017
— 35,000 $44.49 8/17/2018
— 129,300 $29.00 10/6/2018
Naren K. Gursahaney ...... 84,978 — $23.77 3/2/2013 47,027 $1,597,977 58,400 $1,984,432
37,768 — $44.16 3/25/2014
31,473 — $56.87 3/9/2015
25,178 — $46.07 11/21/2015
9,442 — $48.67 1/11/2016
44,062 44,063 $48.14 11/20/2016
35,500 35,500 $53.36 7/1/2017
— 35,000 $44.49 8/17/2018
— 129,300 $29.00 10/6/2018
John E. Evard, Jr. ........ 49,749 — $26.74 12/18/2012 20,118 $ 683,610 34,700 $1,179,106
24,874 — $22.67 3/6/2013
22,387 — $44.16 3/25/2014
22,387 — $56.87 3/9/2015
16,417 — $46.07 11/21/2015
25,178 25,179 $48.14 11/20/2016
19,500 19,500 $53.36 7/1/2017
— 80,000 $29.00 10/6/2018
(1) Vesting dates for each outstanding option award for the named executive officers are as follows:
2010 Proxy Statement 61