ADT 2009 Annual Report Download - page 213
Download and view the complete annual report
Please find page 213 of the 2009 ADT annual report below. You can navigate through the pages in the report by either clicking on the pages listed below, or by using the keyword search tool below to find specific information within the annual report.-
 1
1 -
2
-
3
-
4
-
5
-
6
-
7
-
8
-
9
-
10
-
11
-
12
-
13
-
14
-
15
-
16
-
17
-
18
-
19
-
20
-
21
-
22
-
23
-
24
-
25
-
26
-
27
-
28
-
29
-
30
-
31
-
32
-
33
-
34
-
35
-
36
-
37
-
38
-
39
-
40
-
41
-
42
-
43
-
44
-
45
-
46
-
47
-
48
-
49
-
50
-
51
-
52
-
53
-
54
-
55
-
56
-
57
-
58
-
59
-
60
-
61
-
62
-
63
-
64
-
65
-
66
-
67
-
68
-
69
-
70
-
71
-
72
-
73
-
74
-
75
-
76
-
77
-
78
-
79
-
80
-
81
-
82
-
83
-
84
-
85
-
86
-
87
-
88
-
89
-
90
-
91
-
92
-
93
-
94
-
95
-
96
-
97
-
98
-
99
-
100
-
101
-
102
-
103
-
104
-
105
-
106
-
107
-
108
-
109
-
110
-
111
-
112
-
113
-
114
-
115
-
116
-
117
-
118
-
119
-
120
-
121
-
122
-
123
-
124
-
125
-
126
-
127
-
128
-
129
-
130
-
131
-
132
-
133
-
134
-
135
-
136
-
137
-
138
-
139
-
140
-
141
-
142
-
143
-
144
-
145
-
146
-
147
-
148
-
149
-
150
-
151
-
152
-
153
-
154
-
155
-
156
-
157
-
158
-
159
-
160
-
161
-
162
-
163
-
164
-
165
-
166
-
167
-
168
-
169
-
170
-
171
-
172
-
173
-
174
-
175
-
176
-
177
-
178
-
179
-
180
-
181
-
182
-
183
-
184
-
185
-
186
-
187
-
188
-
189
-
190
-
191
-
192
-
193
-
194
-
195
-
196
-
197
-
198
-
199
-
200
-
201
-
202
-
 203
203 -
 204
204 -
 205
205 -
 206
206 -
 207
207 -
 208
208 -
 209
209 -
 210
210 -
 211
211 -
 212
212 -
 213
213 -
 214
214 -
 215
215 -
 216
216 -
 217
217 -
 218
218 -
 219
219 -
 220
220 -
 221
221 -
 222
222 -
 223
223 -
224
-
225
-
226
-
227
-
228
-
229
-
230
-
231
-
232
-
233
-
234
-
235
-
236
-
237
-
238
-
239
-
240
-
241
-
242
-
243
-
244
-
245
-
246
-
247
-
248
-
249
-
250
-
251
-
252
-
253
-
254
-
255
-
256
-
257
-
258
-
259
-
260
-
261
-
262
-
263
-
264
-
265
-
266
-
267
-
268
-
269
-
270
-
271
-
272
-
273
-
274
-
275
-
276
-
277
-
278
-
279
-
280
-
281
-
282
-
283
-
284
-
285
-
286
-
287
-
288
-
289
-
290
 |
 |

TYCO INTERNATIONAL LTD.
NOTES TO CONSOLIDATED FINANCIAL STATEMENTS
10. Goodwill and Intangible Assets (Continued)
test for indefinite-lived intangible assets involves a comparison of the estimated fair value of the
intangible asset with its carrying amount. If the carrying amount of the intangible asset exceeds its fair
value, an impairment loss is recognized in an amount equal to that excess. Fair value determinations
require considerable judgment and are sensitive to change. Significant judgments inherent in this
analysis include the selection of appropriate discount rates and terminal year growth rate assumptions
and estimates of the amount and timing of future cash flows attributable to the underlying intangible
assets. Discount rate assumptions are based on an assessment of the risk inherent in the projected
future cash flows generated by the intangible asset. Also subject to judgment are assumptions about
royalty rates, which are based on the estimated rates at which similar trademarks are being licensed in
the marketplace.
Given the current economic environment and the uncertainties regarding the potential impact on
the Company’s business, there can be no assurance that the Company’s estimates and assumptions
regarding forecasted cash flow and revenue and operating income growth rates as well as the duration
of the ongoing economic downturn, or the period or strength of recovery, made for purposes of the
annual indefinite-lived intangible asset impairment test will prove to be accurate predictions of the
future. If the Company’s assumptions are not achieved, it is possible that an impairment charge may
need to be recorded. However, it is not possible at this time to determine if an impairment charge
would result or if such charge would be material.
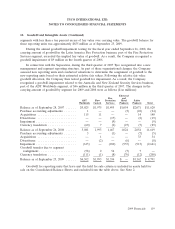
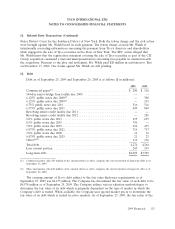
Intangible assets, net were $2,647 million and $2,681 million at September 25, 2009 and
September 26, 2008, respectively. The following table sets forth the gross carrying amount and
accumulated amortization of the Company’s intangible assets as of September 25, 2009 and
September 26, 2008 ($ in millions):
September 25, 2009 September 26, 2008
Gross Weighted-Average Gross Weighted-Average
Carrying Accumulated Amortization Carrying Accumulated Amortization
Amount Amortization Period Amount Amortization Period
Amortizable:
Contracts and related
customer
relationships ..... $6,529 $4,275 14 years $6,088 $3,922 14 years
Intellectual property . 552 462 20 years 553 405 16 years
Other ............ 17 13 10 years 17 13 15 years
Total .............. $7,098 $4,750 14 years $6,658 $4,340 15 years
Non-Amortizable:
Intellectual property . $ 212 $ 253
Other ............ 87 110
Total .............. $ 299 $ 363
Intangible asset amortization expense for 2009, 2008 and 2007 was $516 million, $528 million and
$513 million, respectively. The estimated aggregate amortization expense on intangible assets currently
owned by the Company is expected to be approximately $450 million for 2010, $350 million for 2011,
$300 million for 2012, $300 million for 2013 and $200 million for 2014.
2009 Financials 121