ADT 2009 Annual Report Download - page 59
Download and view the complete annual report
Please find page 59 of the 2009 ADT annual report below. You can navigate through the pages in the report by either clicking on the pages listed below, or by using the keyword search tool below to find specific information within the annual report.-
 1
1 -
2
-
3
-
4
-
5
-
6
-
7
-
8
-
9
-
10
-
11
-
12
-
13
-
14
-
15
-
16
-
17
-
18
-
19
-
20
-
21
-
22
-
23
-
24
-
25
-
26
-
27
-
28
-
29
-
30
-
31
-
32
-
33
-
34
-
35
-
36
-
37
-
38
-
39
-
40
-
41
-
42
-
43
-
44
-
45
-
46
-
47
-
48
-
 49
49 -
 50
50 -
 51
51 -
 52
52 -
 53
53 -
 54
54 -
 55
55 -
 56
56 -
 57
57 -
 58
58 -
 59
59 -
 60
60 -
 61
61 -
 62
62 -
 63
63 -
 64
64 -
 65
65 -
 66
66 -
 67
67 -
 68
68 -
 69
69 -
70
-
71
-
72
-
73
-
74
-
75
-
76
-
77
-
78
-
79
-
80
-
81
-
82
-
83
-
84
-
85
-
86
-
87
-
88
-
89
-
90
-
91
-
92
-
93
-
94
-
95
-
96
-
97
-
98
-
99
-
100
-
101
-
102
-
103
-
104
-
105
-
106
-
107
-
108
-
109
-
110
-
111
-
112
-
113
-
114
-
115
-
116
-
117
-
118
-
119
-
120
-
121
-
122
-
123
-
124
-
125
-
126
-
127
-
128
-
129
-
130
-
131
-
132
-
133
-
134
-
135
-
136
-
137
-
138
-
139
-
140
-
141
-
142
-
143
-
144
-
145
-
146
-
147
-
148
-
149
-
150
-
151
-
152
-
153
-
154
-
155
-
156
-
157
-
158
-
159
-
160
-
161
-
162
-
163
-
164
-
165
-
166
-
167
-
168
-
169
-
170
-
171
-
172
-
173
-
174
-
175
-
176
-
177
-
178
-
179
-
180
-
181
-
182
-
183
-
184
-
185
-
186
-
187
-
188
-
189
-
190
-
191
-
192
-
193
-
194
-
195
-
196
-
197
-
198
-
199
-
200
-
201
-
202
-
203
-
204
-
205
-
206
-
207
-
208
-
209
-
210
-
211
-
212
-
213
-
214
-
215
-
216
-
217
-
218
-
219
-
220
-
221
-
222
-
223
-
224
-
225
-
226
-
227
-
228
-
229
-
230
-
231
-
232
-
233
-
234
-
235
-
236
-
237
-
238
-
239
-
240
-
241
-
242
-
243
-
244
-
245
-
246
-
247
-
248
-
249
-
250
-
251
-
252
-
253
-
254
-
255
-
256
-
257
-
258
-
259
-
260
-
261
-
262
-
263
-
264
-
265
-
266
-
267
-
268
-
269
-
270
-
271
-
272
-
273
-
274
-
275
-
276
-
277
-
278
-
279
-
280
-
281
-
282
-
283
-
284
-
285
-
286
-
287
-
288
-
289
-
290
 |
 |
Process Overview
The Compensation Committee evaluates many factors when designing and establishing executive
compensation plans and targets. In determining the appropriate compensation of individual Senior
Officers, the Compensation Committee considers critical data including the executive’s position in the
Career Band (see ‘‘Elements of Compensation’’ below), the relative complexity and importance of the
executive’s role within the organization, the executive’s experience, performance and potential, the
compensation levels of our peer group, and internal pay equity considerations.
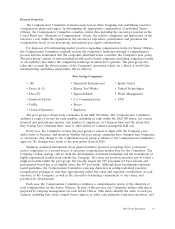
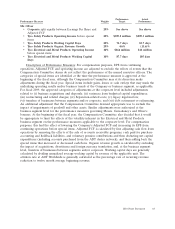
For purposes of benchmarking market practices regarding compensation levels for Senior Officers,
the Compensation Committee carefully reviews the competitive landscape through a comprehensive
process and has determined that the companies identified below constitute the Company’s peer group.
The peer group consists of sixteen industrial and service-based companies (including companies outside
of our industry) that reflect the competitive landscape in which Tyco operates. The peer group also
takes into account the diverse nature of the Company’s operations, which are a blend of world-class
manufacturing capabilities and premier service delivery.
Peer Group Companies
• 3M • Honeywell International • Sprint Nextel
• Deere & Co. • Illinois Tool Works • United Technologies
• DirecTV • Ingersoll-Rand • Waste Management
• Emerson Electric • L-3 Communications • UPS
• FedEx • Masco
• General Dynamics • Raytheon
The peer group is drawn from companies in the S&P 500 Index. The Compensation Committee
analyzes a range of factors for each member, including (i) rank within the S&P 500 Index; (ii) various
financial and performance metrics; (iii) number of employees; (iv) business lines and the extent that
they overlap Tyco’s business lines; and (v) other indicia of common managerial skill sets.
Every year, the Committee reviews the peer group to ensure it aligns with the Company’s size
and/or lines of business, and monitors whether the peer group companies have changed their businesses
or operations. Any change to the compensation peer group is subject to the Compensation Committee’s
approval. No changes were made to the peer group in fiscal 2009.
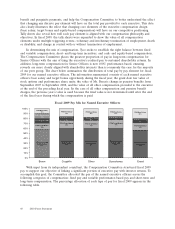
Summary statistical information about general industry practices (excepting those of financial
service companies) is a second source of executive compensation market data for the Committee. The
Company’s talent strategy calls for both the development of internal leadership and the recruitment of
highly experienced leaders from outside the Company. Tyco does not position executive pay to reflect a
single percentile within the peer group, but broadly targets the 50th percentile for base salaries and
performance-based pay at or slightly above the 50th percentile. Although these benchmarks represent
useful guidelines, the Compensation Committee exercises discretion in setting individual executive
compensation packages so that they appropriately reflect the value and expected contributions of each
executive to the Company, as well as the executive’s leadership, commitment to our values, and
potential for advancement.
Each year, the Compensation Committee completes a comprehensive review of the elements of
total compensation for the Senior Officers. As part of this process, the Committee utilizes tally sheets
prepared by company management for each Senior Officer. Tally sheets identify the value of each pay
element, including base salary, annual bonus, sign-on or other cash payments, long-term incentives, and
2010 Proxy Statement 39