ADT 2009 Annual Report Download - page 255
Download and view the complete annual report
Please find page 255 of the 2009 ADT annual report below. You can navigate through the pages in the report by either clicking on the pages listed below, or by using the keyword search tool below to find specific information within the annual report.-
 1
1 -
2
-
3
-
4
-
5
-
6
-
7
-
8
-
9
-
10
-
11
-
12
-
13
-
14
-
15
-
16
-
17
-
18
-
19
-
20
-
21
-
22
-
23
-
24
-
25
-
26
-
27
-
28
-
29
-
30
-
31
-
32
-
33
-
34
-
35
-
36
-
37
-
38
-
39
-
40
-
41
-
42
-
43
-
44
-
45
-
46
-
47
-
48
-
49
-
50
-
51
-
52
-
53
-
54
-
55
-
56
-
57
-
58
-
59
-
60
-
61
-
62
-
63
-
64
-
65
-
66
-
67
-
68
-
69
-
70
-
71
-
72
-
73
-
74
-
75
-
76
-
77
-
78
-
79
-
80
-
81
-
82
-
83
-
84
-
85
-
86
-
87
-
88
-
89
-
90
-
91
-
92
-
93
-
94
-
95
-
96
-
97
-
98
-
99
-
100
-
101
-
102
-
103
-
104
-
105
-
106
-
107
-
108
-
109
-
110
-
111
-
112
-
113
-
114
-
115
-
116
-
117
-
118
-
119
-
120
-
121
-
122
-
123
-
124
-
125
-
126
-
127
-
128
-
129
-
130
-
131
-
132
-
133
-
134
-
135
-
136
-
137
-
138
-
139
-
140
-
141
-
142
-
143
-
144
-
145
-
146
-
147
-
148
-
149
-
150
-
151
-
152
-
153
-
154
-
155
-
156
-
157
-
158
-
159
-
160
-
161
-
162
-
163
-
164
-
165
-
166
-
167
-
168
-
169
-
170
-
171
-
172
-
173
-
174
-
175
-
176
-
177
-
178
-
179
-
180
-
181
-
182
-
183
-
184
-
185
-
186
-
187
-
188
-
189
-
190
-
191
-
192
-
193
-
194
-
195
-
196
-
197
-
198
-
199
-
200
-
201
-
202
-
203
-
204
-
205
-
206
-
207
-
208
-
209
-
210
-
211
-
212
-
213
-
214
-
215
-
216
-
217
-
218
-
219
-
220
-
221
-
222
-
223
-
224
-
225
-
226
-
227
-
228
-
229
-
230
-
231
-
232
-
233
-
234
-
235
-
236
-
237
-
238
-
239
-
240
-
241
-
242
-
243
-
244
-
 245
245 -
 246
246 -
 247
247 -
 248
248 -
 249
249 -
 250
250 -
 251
251 -
 252
252 -
 253
253 -
 254
254 -
 255
255 -
 256
256 -
 257
257 -
 258
258 -
 259
259 -
 260
260 -
 261
261 -
 262
262 -
 263
263 -
 264
264 -
 265
265 -
266
-
267
-
268
-
269
-
270
-
271
-
272
-
273
-
274
-
275
-
276
-
277
-
278
-
279
-
280
-
281
-
282
-
283
-
284
-
285
-
286
-
287
-
288
-
289
-
290
 |
 |

TYCO INTERNATIONAL LTD.
NOTES TO CONSOLIDATED FINANCIAL STATEMENTS
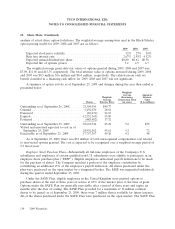
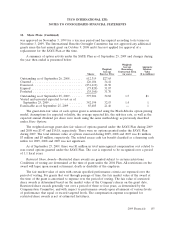
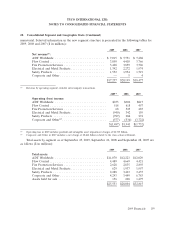
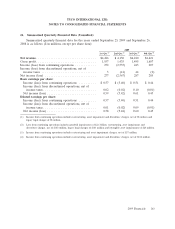
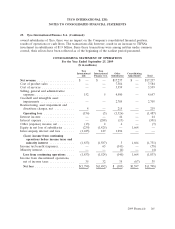
24. Summarized Quarterly Financial Data (Unaudited)
Summarized quarterly financial data for the years ended September 25, 2009 and September 26,
2008 is as follows ($ in millions, except per share data):
2009
1st Qtr.(1) 2nd Qtr.(2) 3rd Qtr.(3) 4th Qtr.(4)
Net revenue .................................. $4,426 $ 4,150 $4,240 $4,421
Gross profit .................................. 1,557 1,435 1,495 1,607
Income (loss) from continuing operations ............ 272 (2,555) 243 207
Income (loss) from discontinued operations, net of
income taxes ............................... 5 (12) 44 (2)
Net income (loss) ............................. 277 (2,567) 287 205
Basic earnings per share:
Income (loss) from continuing operations .......... $ 0.57 $ (5.40) $ 0.51 $ 0.44
Income (loss) from discontinued operations, net of
income taxes .............................. 0.02 (0.02) 0.10 (0.01)
Net income (loss) ............................ 0.59 (5.42) 0.61 0.43
Diluted earnings per share:
Income (loss) from continuing operations .......... 0.57 (5.40) 0.51 0.44
Income (loss) from discontinued operations, net of
income taxes .............................. 0.01 (0.02) 0.09 (0.01)
Net income (loss) ............................ 0.58 (5.42) 0.60 0.43
(1) Income from continuing operations includes restructuring, asset impairment and divestiture charges, net of $8 million and
legacy legal charges of $8 million.
(2) Loss from continuing operations includes goodwill impairments of $2.6 billion, restructuring, asset impairment and
divestiture charges, net of $102 million, legacy legal charges of $101 million and intangible asset impairments of $64 million.
(3) Income from continuing operations includes restructuring and asset impairment charges, net of $37 million.
(4) Income from continuing operations includes restructuring, asset impairment and divestiture charges, net of $104 million.
2009 Financials 163