ADT 2009 Annual Report Download - page 211
Download and view the complete annual report
Please find page 211 of the 2009 ADT annual report below. You can navigate through the pages in the report by either clicking on the pages listed below, or by using the keyword search tool below to find specific information within the annual report.-
 1
1 -
2
-
3
-
4
-
5
-
6
-
7
-
8
-
9
-
10
-
11
-
12
-
13
-
14
-
15
-
16
-
17
-
18
-
19
-
20
-
21
-
22
-
23
-
24
-
25
-
26
-
27
-
28
-
29
-
30
-
31
-
32
-
33
-
34
-
35
-
36
-
37
-
38
-
39
-
40
-
41
-
42
-
43
-
44
-
45
-
46
-
47
-
48
-
49
-
50
-
51
-
52
-
53
-
54
-
55
-
56
-
57
-
58
-
59
-
60
-
61
-
62
-
63
-
64
-
65
-
66
-
67
-
68
-
69
-
70
-
71
-
72
-
73
-
74
-
75
-
76
-
77
-
78
-
79
-
80
-
81
-
82
-
83
-
84
-
85
-
86
-
87
-
88
-
89
-
90
-
91
-
92
-
93
-
94
-
95
-
96
-
97
-
98
-
99
-
100
-
101
-
102
-
103
-
104
-
105
-
106
-
107
-
108
-
109
-
110
-
111
-
112
-
113
-
114
-
115
-
116
-
117
-
118
-
119
-
120
-
121
-
122
-
123
-
124
-
125
-
126
-
127
-
128
-
129
-
130
-
131
-
132
-
133
-
134
-
135
-
136
-
137
-
138
-
139
-
140
-
141
-
142
-
143
-
144
-
145
-
146
-
147
-
148
-
149
-
150
-
151
-
152
-
153
-
154
-
155
-
156
-
157
-
158
-
159
-
160
-
161
-
162
-
163
-
164
-
165
-
166
-
167
-
168
-
169
-
170
-
171
-
172
-
173
-
174
-
175
-
176
-
177
-
178
-
179
-
180
-
181
-
182
-
183
-
184
-
185
-
186
-
187
-
188
-
189
-
190
-
191
-
192
-
193
-
194
-
195
-
196
-
197
-
198
-
199
-
200
-
 201
201 -
 202
202 -
 203
203 -
 204
204 -
 205
205 -
 206
206 -
 207
207 -
 208
208 -
 209
209 -
 210
210 -
 211
211 -
 212
212 -
 213
213 -
 214
214 -
 215
215 -
 216
216 -
 217
217 -
 218
218 -
 219
219 -
 220
220 -
 221
221 -
222
-
223
-
224
-
225
-
226
-
227
-
228
-
229
-
230
-
231
-
232
-
233
-
234
-
235
-
236
-
237
-
238
-
239
-
240
-
241
-
242
-
243
-
244
-
245
-
246
-
247
-
248
-
249
-
250
-
251
-
252
-
253
-
254
-
255
-
256
-
257
-
258
-
259
-
260
-
261
-
262
-
263
-
264
-
265
-
266
-
267
-
268
-
269
-
270
-
271
-
272
-
273
-
274
-
275
-
276
-
277
-
278
-
279
-
280
-
281
-
282
-
283
-
284
-
285
-
286
-
287
-
288
-
289
-
290
 |
 |

TYCO INTERNATIONAL LTD.
NOTES TO CONSOLIDATED FINANCIAL STATEMENTS
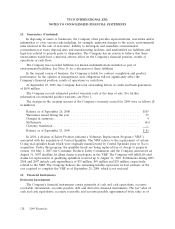
10. Goodwill and Intangible Assets (Continued)
segments with less than a ten percent excess of fair value over carrying value. The goodwill balance for
these reporting units was approximately $855 million as of September 25, 2009.
During the annual goodwill impairment testing for the fiscal year ended September 26, 2008, the
carrying amount of goodwill in the Latin America Fire Protection business, part of the Fire Protection
Services segment, exceeded the implied fair value of goodwill. As a result, the Company recognized a
goodwill impairment of $9 million in the fourth quarter of 2008.
In connection with the Separation, during the third quarter of 2007 Tyco reorganized into a new
management and segment reporting structure. As part of these organizational changes, the Company
assessed new reporting units and conducted valuations to determine the assignment of goodwill to the
new reporting units based on their estimated relative fair values. Following the relative fair value
goodwill allocation, the Company then tested goodwill for impairment. As a result, the Company
recognized a goodwill impairment related to the Australia and New Zealand Security Services business,
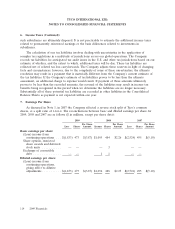
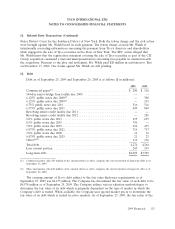
part of the ADT Worldwide segment, of $46 million in the third quarter of 2007. The changes in the
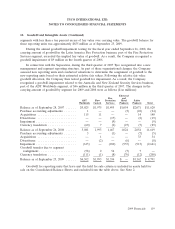
carrying amount of goodwill by segment for 2009 and 2008 were as follows ($ in millions):
Electrical
Fire and
ADT Flow Protection Metal Safety
Worldwide Control Services Products Products Total
Balance as of September 28, 2007 ...... $5,025 $1,975 $1,495 $1,054 $2,071 $11,620
Purchase accounting adjustments ....... 1 — — (3) (22) (24)
Acquisitions ...................... 115 11 — — 14 140
Divestitures ...................... — — (17) — (2) (19)
Impairment ....................... — — (9) — — (9)
Currency translation ................ (60) 7 (2) (27) (7) (89)
Balance as of September 26, 2008 ...... 5,081 1,993 1,467 1,024 2,054 11,619
Purchase accounting adjustments ....... 3 — (1) — (7) (5)
Acquisitions ...................... — 1 — — 33 34
Divestitures ...................... — (2) — (6) — (8)
Impairment ....................... (613) — (180) (935) (913) (2,641)
Goodwill transfer due to segment
realignment ..................... (58) 2 56 (7) 7 —
Currency translation ................ (111) (1) (8) (76) (12) (208)
Balance as of September 25, 2009 ...... $4,302 $1,993 $1,334 $ — $1,162 $ 8,791
Goodwill for reporting units that have met the held for sale criteria is included in assets held for
sale on the Consolidated Balance Sheets and excluded from the table above. See Note 2.
2009 Financials 119