ADT 2009 Annual Report Download - page 234
Download and view the complete annual report
Please find page 234 of the 2009 ADT annual report below. You can navigate through the pages in the report by either clicking on the pages listed below, or by using the keyword search tool below to find specific information within the annual report.-
 1
1 -
2
-
3
-
4
-
5
-
6
-
7
-
8
-
9
-
10
-
11
-
12
-
13
-
14
-
15
-
16
-
17
-
18
-
19
-
20
-
21
-
22
-
23
-
24
-
25
-
26
-
27
-
28
-
29
-
30
-
31
-
32
-
33
-
34
-
35
-
36
-
37
-
38
-
39
-
40
-
41
-
42
-
43
-
44
-
45
-
46
-
47
-
48
-
49
-
50
-
51
-
52
-
53
-
54
-
55
-
56
-
57
-
58
-
59
-
60
-
61
-
62
-
63
-
64
-
65
-
66
-
67
-
68
-
69
-
70
-
71
-
72
-
73
-
74
-
75
-
76
-
77
-
78
-
79
-
80
-
81
-
82
-
83
-
84
-
85
-
86
-
87
-
88
-
89
-
90
-
91
-
92
-
93
-
94
-
95
-
96
-
97
-
98
-
99
-
100
-
101
-
102
-
103
-
104
-
105
-
106
-
107
-
108
-
109
-
110
-
111
-
112
-
113
-
114
-
115
-
116
-
117
-
118
-
119
-
120
-
121
-
122
-
123
-
124
-
125
-
126
-
127
-
128
-
129
-
130
-
131
-
132
-
133
-
134
-
135
-
136
-
137
-
138
-
139
-
140
-
141
-
142
-
143
-
144
-
145
-
146
-
147
-
148
-
149
-
150
-
151
-
152
-
153
-
154
-
155
-
156
-
157
-
158
-
159
-
160
-
161
-
162
-
163
-
164
-
165
-
166
-
167
-
168
-
169
-
170
-
171
-
172
-
173
-
174
-
175
-
176
-
177
-
178
-
179
-
180
-
181
-
182
-
183
-
184
-
185
-
186
-
187
-
188
-
189
-
190
-
191
-
192
-
193
-
194
-
195
-
196
-
197
-
198
-
199
-
200
-
201
-
202
-
203
-
204
-
205
-
206
-
207
-
208
-
209
-
210
-
211
-
212
-
213
-
214
-
215
-
216
-
217
-
218
-
219
-
220
-
221
-
222
-
223
-
 224
224 -
 225
225 -
 226
226 -
 227
227 -
 228
228 -
 229
229 -
 230
230 -
 231
231 -
 232
232 -
 233
233 -
 234
234 -
 235
235 -
 236
236 -
 237
237 -
 238
238 -
 239
239 -
 240
240 -
 241
241 -
 242
242 -
 243
243 -
 244
244 -
245
-
246
-
247
-
248
-
249
-
250
-
251
-
252
-
253
-
254
-
255
-
256
-
257
-
258
-
259
-
260
-
261
-
262
-
263
-
264
-
265
-
266
-
267
-
268
-
269
-
270
-
271
-
272
-
273
-
274
-
275
-
276
-
277
-
278
-
279
-
280
-
281
-
282
-
283
-
284
-
285
-
286
-
287
-
288
-
289
-
290
 |
 |

TYCO INTERNATIONAL LTD.
NOTES TO CONSOLIDATED FINANCIAL STATEMENTS
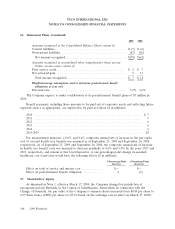
16. Retirement Plans (Continued)
The net periodic benefit cost for all U.S. and non-U.S. defined benefit pension plans for 2009,
2008 and 2007 is as follows ($ in millions):
U.S. Plans Non-U.S. Plans
2009 2008 2007 2009 2008 2007
Service cost .................................... $ 9 $ 8 $ 9 $28 $45 $46
Interest cost .................................... 49 47 47 69 82 73
Expected return on plan assets ....................... (49) (58) (56) (61) (82) (74)
Amortization of initial net asset ......................————(1)(1)
Amortization of prior service cost (credit) ..............111(2)(3)(3)
Amortization of net actuarial loss .................... 9 5 12 15 19 30
Plan settlements, curtailments and special termination
benefits ......................................———(1)(2)2
Net periodic benefit cost ......................... $19 $ 3 $13 $48 $58 $73
Weighted-average assumptions used to determine net periodic
pension cost during the year:
Discount rate ................................... 7.6% 6.3% 6.0% 6.5% 5.6% 4.9%
Expected return on plan assets ....................... 8.0% 8.0% 8.0% 7.0% 7.1% 7.0%
Rate of compensation increase ....................... 4.0% 4.0% 4.0% 4.5% 4.4% 4.1%
The estimated net loss and prior service cost for U.S. pension benefit plans that will be amortized
from accumulated other comprehensive (loss) income into net periodic benefit cost over the next fiscal
year are expected to be $26 million and $1 million, respectively.
The estimated net loss and prior service credit for non-U.S. pension benefit plans that will be
amortized from accumulated other comprehensive (loss) income into net periodic benefit cost over the
next fiscal year are expected to be $29 million and $3 million, respectively.
142 2009 Financials