ADT 2009 Annual Report Download - page 236
Download and view the complete annual report
Please find page 236 of the 2009 ADT annual report below. You can navigate through the pages in the report by either clicking on the pages listed below, or by using the keyword search tool below to find specific information within the annual report.-
 1
1 -
2
-
3
-
4
-
5
-
6
-
7
-
8
-
9
-
10
-
11
-
12
-
13
-
14
-
15
-
16
-
17
-
18
-
19
-
20
-
21
-
22
-
23
-
24
-
25
-
26
-
27
-
28
-
29
-
30
-
31
-
32
-
33
-
34
-
35
-
36
-
37
-
38
-
39
-
40
-
41
-
42
-
43
-
44
-
45
-
46
-
47
-
48
-
49
-
50
-
51
-
52
-
53
-
54
-
55
-
56
-
57
-
58
-
59
-
60
-
61
-
62
-
63
-
64
-
65
-
66
-
67
-
68
-
69
-
70
-
71
-
72
-
73
-
74
-
75
-
76
-
77
-
78
-
79
-
80
-
81
-
82
-
83
-
84
-
85
-
86
-
87
-
88
-
89
-
90
-
91
-
92
-
93
-
94
-
95
-
96
-
97
-
98
-
99
-
100
-
101
-
102
-
103
-
104
-
105
-
106
-
107
-
108
-
109
-
110
-
111
-
112
-
113
-
114
-
115
-
116
-
117
-
118
-
119
-
120
-
121
-
122
-
123
-
124
-
125
-
126
-
127
-
128
-
129
-
130
-
131
-
132
-
133
-
134
-
135
-
136
-
137
-
138
-
139
-
140
-
141
-
142
-
143
-
144
-
145
-
146
-
147
-
148
-
149
-
150
-
151
-
152
-
153
-
154
-
155
-
156
-
157
-
158
-
159
-
160
-
161
-
162
-
163
-
164
-
165
-
166
-
167
-
168
-
169
-
170
-
171
-
172
-
173
-
174
-
175
-
176
-
177
-
178
-
179
-
180
-
181
-
182
-
183
-
184
-
185
-
186
-
187
-
188
-
189
-
190
-
191
-
192
-
193
-
194
-
195
-
196
-
197
-
198
-
199
-
200
-
201
-
202
-
203
-
204
-
205
-
206
-
207
-
208
-
209
-
210
-
211
-
212
-
213
-
214
-
215
-
216
-
217
-
218
-
219
-
220
-
221
-
222
-
223
-
224
-
225
-
 226
226 -
 227
227 -
 228
228 -
 229
229 -
 230
230 -
 231
231 -
 232
232 -
 233
233 -
 234
234 -
 235
235 -
 236
236 -
 237
237 -
 238
238 -
 239
239 -
 240
240 -
 241
241 -
 242
242 -
 243
243 -
 244
244 -
 245
245 -
 246
246 -
247
-
248
-
249
-
250
-
251
-
252
-
253
-
254
-
255
-
256
-
257
-
258
-
259
-
260
-
261
-
262
-
263
-
264
-
265
-
266
-
267
-
268
-
269
-
270
-
271
-
272
-
273
-
274
-
275
-
276
-
277
-
278
-
279
-
280
-
281
-
282
-
283
-
284
-
285
-
286
-
287
-
288
-
289
-
290
 |
 |

TYCO INTERNATIONAL LTD.
NOTES TO CONSOLIDATED FINANCIAL STATEMENTS
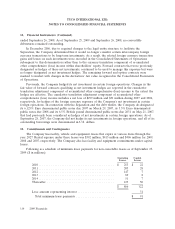
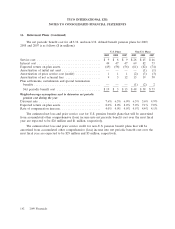
16. Retirement Plans (Continued)
$61 million, net of income taxes of $28 million. See Note 1 for additional information related to the
adoption of the guidance.
U.S. Plans Non-U.S. Plans
2009 2008 2009 2008
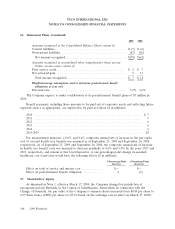
Amounts recognized in the Consolidated Balance Sheets consist of:
Non-current assets .................................... $ — $ 6 $ 6 $ 3
Current liabilities ..................................... (3) (4) (11) (11)
Non-current liabilities .................................. (229) (50) (385) (321)
Net amount recognized ............................... $(232) $ (48) $(390) $(329)
Amounts recognized in accumulated other comprehensive (loss)
income (before income taxes) consist of: ....................
Transition asset ...................................... $ — $ — $ 4 $ 5
Prior service (cost) credit ............................... (7) (8) 25 32
Net actuarial loss ..................................... (363) (178) (418) (379)
Total loss recognized ................................. $(370) $(186) $(389) $(342)
Weighted-average assumptions used to determine pension benefit
obligations at year end:
Discount rate ........................................ 5.5% 7.0% 5.6% 5.9%
Rate of compensation increase ........................... 4.0% 4.0% 4.2% 4.7%
The accumulated benefit obligation for all U.S. plans as of September 25, 2009 and September 26,
2008 was $862 million and $720 million, respectively. The accumulated benefit obligation for all
non-U.S. plans as of September 25, 2009 and September 26, 2008 was $1,287 million and
$1,356 million, respectively.
The accumulated benefit obligation and fair value of plan assets for U.S. pension plans with
accumulated benefit obligations in excess of plan assets were $862 million and $631 million,
respectively, as of September 25, 2009 and $470 million and $415 million, respectively, as of
September 26, 2008.
The accumulated benefit obligation and fair value of plan assets for non-U.S. pension plans with
accumulated benefit obligations in excess of plan assets were $1,264 million and $919 million,
respectively, as of September 25, 2009 and $1,333 million and $1,054 million, respectively, as of
September 26, 2008.
The aggregate benefit obligation and fair value of plan assets for U.S. pension plans with benefit
obligations in excess of plan assets were $864 million and $631 million, respectively, as of
September 25, 2009 and $472 million and $415 million, respectively, as of September 26, 2008.
The aggregate benefit obligation and fair value of plan assets for non-U.S. pension plans with
benefit obligations in excess of plan assets were $1,323 million and $927 million, respectively, as of
September 25, 2009 and $1,395 million and $1,061 million, respectively, as of September 26, 2008.
144 2009 Financials