ADT 2009 Annual Report Download - page 122
Download and view the complete annual report
Please find page 122 of the 2009 ADT annual report below. You can navigate through the pages in the report by either clicking on the pages listed below, or by using the keyword search tool below to find specific information within the annual report.-
 1
1 -
2
-
3
-
4
-
5
-
6
-
7
-
8
-
9
-
10
-
11
-
12
-
13
-
14
-
15
-
16
-
17
-
18
-
19
-
20
-
21
-
22
-
23
-
24
-
25
-
26
-
27
-
28
-
29
-
30
-
31
-
32
-
33
-
34
-
35
-
36
-
37
-
38
-
39
-
40
-
41
-
42
-
43
-
44
-
45
-
46
-
47
-
48
-
49
-
50
-
51
-
52
-
53
-
54
-
55
-
56
-
57
-
58
-
59
-
60
-
61
-
62
-
63
-
64
-
65
-
66
-
67
-
68
-
69
-
70
-
71
-
72
-
73
-
74
-
75
-
76
-
77
-
78
-
79
-
80
-
81
-
82
-
83
-
84
-
85
-
86
-
87
-
88
-
89
-
90
-
91
-
92
-
93
-
94
-
95
-
96
-
97
-
98
-
99
-
100
-
101
-
102
-
103
-
104
-
105
-
106
-
107
-
108
-
109
-
110
-
111
-
 112
112 -
 113
113 -
 114
114 -
 115
115 -
 116
116 -
 117
117 -
 118
118 -
 119
119 -
 120
120 -
 121
121 -
 122
122 -
 123
123 -
 124
124 -
 125
125 -
 126
126 -
 127
127 -
 128
128 -
 129
129 -
 130
130 -
 131
131 -
 132
132 -
133
-
134
-
135
-
136
-
137
-
138
-
139
-
140
-
141
-
142
-
143
-
144
-
145
-
146
-
147
-
148
-
149
-
150
-
151
-
152
-
153
-
154
-
155
-
156
-
157
-
158
-
159
-
160
-
161
-
162
-
163
-
164
-
165
-
166
-
167
-
168
-
169
-
170
-
171
-
172
-
173
-
174
-
175
-
176
-
177
-
178
-
179
-
180
-
181
-
182
-
183
-
184
-
185
-
186
-
187
-
188
-
189
-
190
-
191
-
192
-
193
-
194
-
195
-
196
-
197
-
198
-
199
-
200
-
201
-
202
-
203
-
204
-
205
-
206
-
207
-
208
-
209
-
210
-
211
-
212
-
213
-
214
-
215
-
216
-
217
-
218
-
219
-
220
-
221
-
222
-
223
-
224
-
225
-
226
-
227
-
228
-
229
-
230
-
231
-
232
-
233
-
234
-
235
-
236
-
237
-
238
-
239
-
240
-
241
-
242
-
243
-
244
-
245
-
246
-
247
-
248
-
249
-
250
-
251
-
252
-
253
-
254
-
255
-
256
-
257
-
258
-
259
-
260
-
261
-
262
-
263
-
264
-
265
-
266
-
267
-
268
-
269
-
270
-
271
-
272
-
273
-
274
-
275
-
276
-
277
-
278
-
279
-
280
-
281
-
282
-
283
-
284
-
285
-
286
-
287
-
288
-
289
-
290
 |
 |

5JAN201013374485
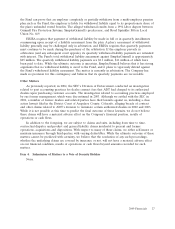
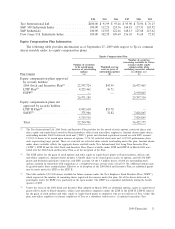
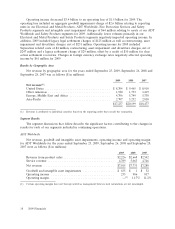
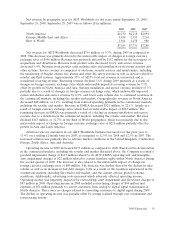
Performance Graph
Set forth below is a graph comparing the cumulative total shareholder return on Tyco’s common
shares against the cumulative return on the S&P 500 Index, Dow Jones U.S. Industrials Index and the
S&P 500 Industrials Index, assuming investment of $100 on September 30, 2004, including the
reinvestment of dividends. The graph shows the cumulative total return as of the fiscal years ended
September 30, 2005, September 29, 2006, September 28, 2007, September 26, 2008 and September 25,
2009. In July 2007, Tyco began using performance share units as a component of its annual equity
incentive program. The benchmark against which Tyco’s total shareholder return is measured is the
S&P 500 Industrials Index. As a result, the S&P 500 Industrials Index will replace the Dow Jones U.S.
Industrials Index in the performance graph below.
$0
$50
$100
$150
$200
2004 2005 2006 2007 2008 2009
S&P 500 Industrials Index Dow Jones U.S. Industrials Index
S&P 500 IndexTyco International Ltd.
Total Return To Shareholders
(Includes reinvestment of dividends)
Annual Return Percentage
Years Ended
Company/Index 9/05 9/06 9/07 9/08 9/09
Tyco International Ltd. ............................ (8.01) 1.59 2.61 (17.67) (3.58)
S&P 500 Index .................................. 12.25 10.79 16.44 (18.85) (11.56)
S&P 500 Industrials Index .......................... 13.03 8.34 20.96 (15.16) (8.00)
Dow Jones U.S. Industrials Index ..................... 2.38 7.14 24.01 (32.60) (20.46)
30 2009 Financials