ADT 2009 Annual Report Download - page 147
Download and view the complete annual report
Please find page 147 of the 2009 ADT annual report below. You can navigate through the pages in the report by either clicking on the pages listed below, or by using the keyword search tool below to find specific information within the annual report.-
 1
1 -
2
-
3
-
4
-
5
-
6
-
7
-
8
-
9
-
10
-
11
-
12
-
13
-
14
-
15
-
16
-
17
-
18
-
19
-
20
-
21
-
22
-
23
-
24
-
25
-
26
-
27
-
28
-
29
-
30
-
31
-
32
-
33
-
34
-
35
-
36
-
37
-
38
-
39
-
40
-
41
-
42
-
43
-
44
-
45
-
46
-
47
-
48
-
49
-
50
-
51
-
52
-
53
-
54
-
55
-
56
-
57
-
58
-
59
-
60
-
61
-
62
-
63
-
64
-
65
-
66
-
67
-
68
-
69
-
70
-
71
-
72
-
73
-
74
-
75
-
76
-
77
-
78
-
79
-
80
-
81
-
82
-
83
-
84
-
85
-
86
-
87
-
88
-
89
-
90
-
91
-
92
-
93
-
94
-
95
-
96
-
97
-
98
-
99
-
100
-
101
-
102
-
103
-
104
-
105
-
106
-
107
-
108
-
109
-
110
-
111
-
112
-
113
-
114
-
115
-
116
-
117
-
118
-
119
-
120
-
121
-
122
-
123
-
124
-
125
-
126
-
127
-
128
-
129
-
130
-
131
-
132
-
133
-
134
-
135
-
136
-
 137
137 -
 138
138 -
 139
139 -
 140
140 -
 141
141 -
 142
142 -
 143
143 -
 144
144 -
 145
145 -
 146
146 -
 147
147 -
 148
148 -
 149
149 -
 150
150 -
 151
151 -
 152
152 -
 153
153 -
 154
154 -
 155
155 -
 156
156 -
 157
157 -
158
-
159
-
160
-
161
-
162
-
163
-
164
-
165
-
166
-
167
-
168
-
169
-
170
-
171
-
172
-
173
-
174
-
175
-
176
-
177
-
178
-
179
-
180
-
181
-
182
-
183
-
184
-
185
-
186
-
187
-
188
-
189
-
190
-
191
-
192
-
193
-
194
-
195
-
196
-
197
-
198
-
199
-
200
-
201
-
202
-
203
-
204
-
205
-
206
-
207
-
208
-
209
-
210
-
211
-
212
-
213
-
214
-
215
-
216
-
217
-
218
-
219
-
220
-
221
-
222
-
223
-
224
-
225
-
226
-
227
-
228
-
229
-
230
-
231
-
232
-
233
-
234
-
235
-
236
-
237
-
238
-
239
-
240
-
241
-
242
-
243
-
244
-
245
-
246
-
247
-
248
-
249
-
250
-
251
-
252
-
253
-
254
-
255
-
256
-
257
-
258
-
259
-
260
-
261
-
262
-
263
-
264
-
265
-
266
-
267
-
268
-
269
-
270
-
271
-
272
-
273
-
274
-
275
-
276
-
277
-
278
-
279
-
280
-
281
-
282
-
283
-
284
-
285
-
286
-
287
-
288
-
289
-
290
 |
 |

equity and fixed income securities. Although we do not believe we will be required to make materially
higher cash contributions in the next 12 months, if market conditions worsen, we may be required to
make incremental cash contributions under local statutory law.
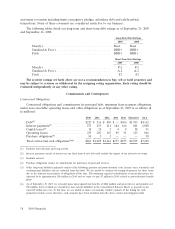
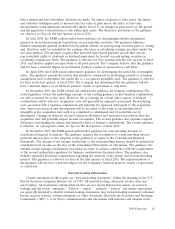
The sources of our cash flow from operating activities and the use of a portion of that cash in our
operations for the years ended September 25, 2009, September 26, 2008 and September 28, 2007 were
as follows ($ in millions):
2009 2008 2007
Cash flows from operating activities:
Operating (loss) income ..................................... $(1,487) $ 1,941 $(1,732)
Goodwill and intangible asset impairments ....................... 2,705 10 59
Non-cash restructuring and asset impairment charges, net ............ 23 36 11
Losses on divestitures ...................................... 13 — 4
Depreciation and amortization(1) .............................. 1,133 1,154 1,148
Non-cash compensation expense ............................... 103 99 173
Deferred income taxes ...................................... (83) (94) (16)
Provision for losses on accounts receivable and inventory ............. 156 135 94
(Gain) loss on the retirement of debt ........................... (2) 258 259
Other, net ............................................... 61 (124) (231)
Class action settlement liability ................................ — (3,020) 2,992
Net change in working capital ................................ 142 (646) (414)
Interest income ........................................... 44 110 104
Interest expense .......................................... (301) (396) (313)
Income tax expense ........................................ (78) (335) (324)
Net cash provided by (used in) operating activities ................. $2,429 $ (872) $ 1,814
Other cash flow items:
Capital expenditures, net(2) ................................... $ (696) $ (706) $ (643)
Decrease in sale of accounts receivable .......................... 10 14 7
Accounts purchased from ADT dealer program .................... (543) (376) (409)
Purchase accounting and holdback liabilities ...................... (2) (2) (10)
Voluntary pension contributions ............................... 22 4 23
(1) Includes depreciation expense of $617 million, $626 million and $635 million in 2009, 2008 and 2007, respectively, and
amortization of intangible assets of $516 million, $528 million and $513 million in 2009, 2008 and 2007, respectively.
(2) Includes net proceeds of $13 million, $28 million and $23 million received for the sale/disposition of property, plant and
equipment in 2009, 2008 and 2007, respectively.
The net change in working capital increased operating cash flow by $142 million in 2009. The
components of this change are set forth in detail in the Consolidated Statements of Cash Flows. The
significant changes in working capital included a $367 million decrease in inventory, a $207 million
decrease in accounts receivable, a $106 million decrease in contracts in progress, offset by a
$352 million decrease in accounts payable and a $148 million decrease in income taxes, net.
During 2009, we completed the sale of all of our remaining Infrastructure Services businesses for
net cash proceeds of $66 million.
We continue to fund capital expenditures to grow our business, improve the cost structure of our
businesses, to invest in new processes and technology, and to maintain high quality production
standards. The level of capital expenditures in 2010 is expected to exceed spending levels in 2009 and is
also expected to exceed depreciation.
2009 Financials 55