ADT 2009 Annual Report Download - page 246
Download and view the complete annual report
Please find page 246 of the 2009 ADT annual report below. You can navigate through the pages in the report by either clicking on the pages listed below, or by using the keyword search tool below to find specific information within the annual report.-
 1
1 -
2
-
3
-
4
-
5
-
6
-
7
-
8
-
9
-
10
-
11
-
12
-
13
-
14
-
15
-
16
-
17
-
18
-
19
-
20
-
21
-
22
-
23
-
24
-
25
-
26
-
27
-
28
-
29
-
30
-
31
-
32
-
33
-
34
-
35
-
36
-
37
-
38
-
39
-
40
-
41
-
42
-
43
-
44
-
45
-
46
-
47
-
48
-
49
-
50
-
51
-
52
-
53
-
54
-
55
-
56
-
57
-
58
-
59
-
60
-
61
-
62
-
63
-
64
-
65
-
66
-
67
-
68
-
69
-
70
-
71
-
72
-
73
-
74
-
75
-
76
-
77
-
78
-
79
-
80
-
81
-
82
-
83
-
84
-
85
-
86
-
87
-
88
-
89
-
90
-
91
-
92
-
93
-
94
-
95
-
96
-
97
-
98
-
99
-
100
-
101
-
102
-
103
-
104
-
105
-
106
-
107
-
108
-
109
-
110
-
111
-
112
-
113
-
114
-
115
-
116
-
117
-
118
-
119
-
120
-
121
-
122
-
123
-
124
-
125
-
126
-
127
-
128
-
129
-
130
-
131
-
132
-
133
-
134
-
135
-
136
-
137
-
138
-
139
-
140
-
141
-
142
-
143
-
144
-
145
-
146
-
147
-
148
-
149
-
150
-
151
-
152
-
153
-
154
-
155
-
156
-
157
-
158
-
159
-
160
-
161
-
162
-
163
-
164
-
165
-
166
-
167
-
168
-
169
-
170
-
171
-
172
-
173
-
174
-
175
-
176
-
177
-
178
-
179
-
180
-
181
-
182
-
183
-
184
-
185
-
186
-
187
-
188
-
189
-
190
-
191
-
192
-
193
-
194
-
195
-
196
-
197
-
198
-
199
-
200
-
201
-
202
-
203
-
204
-
205
-
206
-
207
-
208
-
209
-
210
-
211
-
212
-
213
-
214
-
215
-
216
-
217
-
218
-
219
-
220
-
221
-
222
-
223
-
224
-
225
-
226
-
227
-
228
-
229
-
230
-
231
-
232
-
233
-
234
-
235
-
 236
236 -
 237
237 -
 238
238 -
 239
239 -
 240
240 -
 241
241 -
 242
242 -
 243
243 -
 244
244 -
 245
245 -
 246
246 -
 247
247 -
 248
248 -
 249
249 -
 250
250 -
 251
251 -
 252
252 -
 253
253 -
 254
254 -
 255
255 -
 256
256 -
257
-
258
-
259
-
260
-
261
-
262
-
263
-
264
-
265
-
266
-
267
-
268
-
269
-
270
-
271
-
272
-
273
-
274
-
275
-
276
-
277
-
278
-
279
-
280
-
281
-
282
-
283
-
284
-
285
-
286
-
287
-
288
-
289
-
290
 |
 |

TYCO INTERNATIONAL LTD.
NOTES TO CONSOLIDATED FINANCIAL STATEMENTS
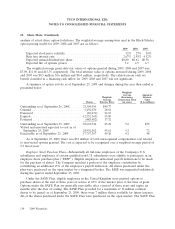
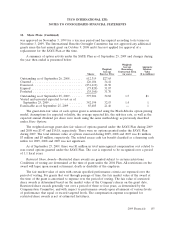
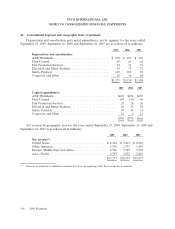
18. Share Plans (Continued)
analysis of actual share option forfeitures. The weighted-average assumptions used in the Black-Scholes
option pricing model for 2009, 2008 and 2007 are as follows:
2009 2008 2007
Expected stock price volatility .............................. 32% 27% 30%
Risk free interest rate .................................... 2.67% 2.93% 4.52%
Expected annual dividend per share .......................... $0.80 $0.62 $0.58
Expected life of options (years) ............................. 5.2 4.5 4.7
The weighted-average grant-date fair values of options granted during 2009, 2008 and 2007 was
$7.09, $11.06 and $15.35, respectively. The total intrinsic value of options exercised during 2009, 2008
and 2007 was $0.5 million, $16 million and $163 million, respectively. The related excess cash tax
benefit classified as a financing cash inflow for 2009, 2008 and 2007 was not significant.
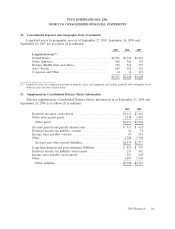
A summary of option activity as of September 25, 2009 and changes during the year then ended is
presented below:
Weighted-
Average Aggregate
Weighted- Remaining Intrinsic
Average Contractual Term Value
Shares Exercise Price (in years) ($ in millions)
Outstanding as of September 26, 2008 ..... 23,304,454 $49.77
Granted ........................... 5,492,070 28.81
Exercised .......................... (82,431) 22.67
Expired ............................ (2,532,365) 53.80
Forfeited ........................... (488,982) 37.32
Outstanding as of September 25, 2009 ..... 25,692,746 45.22 5.6 $75
Vested and unvested expected to vest as of
September 25, 2009 ................. 24,936,862 45.61 5.5 72
Exercisable as of September 25, 2009 ...... 17,757,367 49.26 4.2 48
As of September 25, 2009, there was $51 million of total unrecognized compensation cost related
to non-vested options granted. The cost is expected to be recognized over a weighted-average period of
2.2 fiscal years.
Employee Stock Purchase Plans—Substantially all full-time employees of the Company’s U.S.
subsidiaries and employees of certain qualified non-U.S. subsidiaries were eligible to participate in an
employee share purchase plan (‘‘ESPP’’). Eligible employees authorized payroll deductions to be made
for the purchase of shares. The Company matched a portion of the employee contribution by
contributing an additional 15% of the employee’s payroll deduction. All shares purchased under the
plan were purchased on the open market by a designated broker. The ESSP was suspended indefinitely
during the quarter ended September 25, 2009.
Under the SAYE Plan, eligible employees in the United Kingdom were granted options to
purchase shares at the end of three years of service at 85% of the market price at the time of grant.
Options under the SAYE Plan are generally exercisable after a period of three years and expire six
months after the date of vesting. The SAYE Plan provided for a maximum of 10 million common
shares to be issued; as of September 25, 2009, there were 7 million shares available for future issuance.
All of the shares purchased under the SAYE Plan were purchased on the open market. The SAYE Plan
154 2009 Financials