ADT 2009 Annual Report Download - page 183
Download and view the complete annual report
Please find page 183 of the 2009 ADT annual report below. You can navigate through the pages in the report by either clicking on the pages listed below, or by using the keyword search tool below to find specific information within the annual report.-
 1
1 -
2
-
3
-
4
-
5
-
6
-
7
-
8
-
9
-
10
-
11
-
12
-
13
-
14
-
15
-
16
-
17
-
18
-
19
-
20
-
21
-
22
-
23
-
24
-
25
-
26
-
27
-
28
-
29
-
30
-
31
-
32
-
33
-
34
-
35
-
36
-
37
-
38
-
39
-
40
-
41
-
42
-
43
-
44
-
45
-
46
-
47
-
48
-
49
-
50
-
51
-
52
-
53
-
54
-
55
-
56
-
57
-
58
-
59
-
60
-
61
-
62
-
63
-
64
-
65
-
66
-
67
-
68
-
69
-
70
-
71
-
72
-
73
-
74
-
75
-
76
-
77
-
78
-
79
-
80
-
81
-
82
-
83
-
84
-
85
-
86
-
87
-
88
-
89
-
90
-
91
-
92
-
93
-
94
-
95
-
96
-
97
-
98
-
99
-
100
-
101
-
102
-
103
-
104
-
105
-
106
-
107
-
108
-
109
-
110
-
111
-
112
-
113
-
114
-
115
-
116
-
117
-
118
-
119
-
120
-
121
-
122
-
123
-
124
-
125
-
126
-
127
-
128
-
129
-
130
-
131
-
132
-
133
-
134
-
135
-
136
-
137
-
138
-
139
-
140
-
141
-
142
-
143
-
144
-
145
-
146
-
147
-
148
-
149
-
150
-
151
-
152
-
153
-
154
-
155
-
156
-
157
-
158
-
159
-
160
-
161
-
162
-
163
-
164
-
165
-
166
-
167
-
168
-
169
-
170
-
171
-
172
-
 173
173 -
 174
174 -
 175
175 -
 176
176 -
 177
177 -
 178
178 -
 179
179 -
 180
180 -
 181
181 -
 182
182 -
 183
183 -
 184
184 -
 185
185 -
 186
186 -
 187
187 -
 188
188 -
 189
189 -
 190
190 -
 191
191 -
 192
192 -
 193
193 -
194
-
195
-
196
-
197
-
198
-
199
-
200
-
201
-
202
-
203
-
204
-
205
-
206
-
207
-
208
-
209
-
210
-
211
-
212
-
213
-
214
-
215
-
216
-
217
-
218
-
219
-
220
-
221
-
222
-
223
-
224
-
225
-
226
-
227
-
228
-
229
-
230
-
231
-
232
-
233
-
234
-
235
-
236
-
237
-
238
-
239
-
240
-
241
-
242
-
243
-
244
-
245
-
246
-
247
-
248
-
249
-
250
-
251
-
252
-
253
-
254
-
255
-
256
-
257
-
258
-
259
-
260
-
261
-
262
-
263
-
264
-
265
-
266
-
267
-
268
-
269
-
270
-
271
-
272
-
273
-
274
-
275
-
276
-
277
-
278
-
279
-
280
-
281
-
282
-
283
-
284
-
285
-
286
-
287
-
288
-
289
-
290
 |
 |
TYCO INTERNATIONAL LTD.
NOTES TO CONSOLIDATED FINANCIAL STATEMENTS
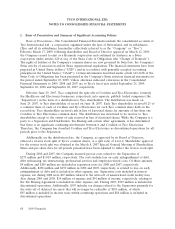
1. Basis of Presentation and Summary of Significant Accounting Policies (Continued)
Cash and Cash Equivalents—All highly liquid investments with maturities of three months or less
from the time of purchase are considered to be cash equivalents.
Allowance for Doubtful Accounts—The allowance for doubtful accounts receivable reflects the best
estimate of probable losses inherent in Tyco’s receivable portfolio determined on the basis of historical
experience, specific allowances for known troubled accounts and other currently available evidence.
Inventories—Inventories are recorded at the lower of cost (primarily first-in, first-out) or market
value.
Property, Plant and Equipment, Net—Property, Plant and Equipment, net is recorded at cost less
accumulated depreciation. Depreciation expense for 2009, 2008 and 2007 was $617 million, $626 million
and $635 million, respectively. Maintenance and repair expenditures are charged to expense when
incurred. Except for pooled subscriber systems, depreciation is calculated using the straight-line method
over the estimated useful lives of the related assets as follows:
Buildings and related improvements . . 5 to 50 years
Leasehold improvements .......... Lesser of remaining term of the lease or
economic useful life
Subscriber systems .............. Accelerated method up to 15 years
Other machinery, equipment and
furniture and fixtures ........... 2 to 20 years
See below for discussion of depreciation method and estimated useful lives related to subscriber
systems.
Subscriber System Assets and Related Deferred Revenue Accounts—The Company generally considers
assets related to the acquisition of new customers in its electronic security business in three asset
categories: internally generated residential subscriber systems, internally generated commercial
subscriber systems (collectively referred to as subscriber system assets) and customer accounts acquired
through the ADT dealer program (referred to as dealer intangibles). Subscriber system assets include
installed property, plant and equipment for which Tyco retains ownership and deferred costs directly
related to the customer acquisition and system installation. Subscriber system assets represent
capitalized equipment (e.g. security control panels, touchpad, motion detectors, window sensors, and
other equipment) and installation costs associated with electronic security monitoring arrangements
under which the Company retains ownership of the security system assets in a customer’s residence or
place of business. Installation costs represent costs incurred to prepare the asset for its intended use.
The Company pays property taxes on the subscriber system assets and upon customer termination, may
retrieve such assets. These assets embody a probable future economic benefit as they generate future
monitoring revenue for the Company.
Costs related to the subscriber system equipment and installation are categorized as property, plant
and equipment rather than deferred costs. Deferred costs associated with subscriber system assets
represent direct and incremental selling expenses (i.e. commissions) related to acquiring the customer.
Commissions related to up-front consideration paid by customers in connection with the establishment
of the monitoring arrangement are determined based on a percentage of the up-front fees and do not
exceed deferred revenue. Such deferred costs are recorded as non-current assets and are included in
the Other Assets line item within the Consolidated Balance Sheets.
2009 Financials 91