ADT 2009 Annual Report Download - page 60
Download and view the complete annual report
Please find page 60 of the 2009 ADT annual report below. You can navigate through the pages in the report by either clicking on the pages listed below, or by using the keyword search tool below to find specific information within the annual report.-
 1
1 -
2
-
3
-
4
-
5
-
6
-
7
-
8
-
9
-
10
-
11
-
12
-
13
-
14
-
15
-
16
-
17
-
18
-
19
-
20
-
21
-
22
-
23
-
24
-
25
-
26
-
27
-
28
-
29
-
30
-
31
-
32
-
33
-
34
-
35
-
36
-
37
-
38
-
39
-
40
-
41
-
42
-
43
-
44
-
45
-
46
-
47
-
48
-
49
-
 50
50 -
 51
51 -
 52
52 -
 53
53 -
 54
54 -
 55
55 -
 56
56 -
 57
57 -
 58
58 -
 59
59 -
 60
60 -
 61
61 -
 62
62 -
 63
63 -
 64
64 -
 65
65 -
 66
66 -
 67
67 -
 68
68 -
 69
69 -
 70
70 -
71
-
72
-
73
-
74
-
75
-
76
-
77
-
78
-
79
-
80
-
81
-
82
-
83
-
84
-
85
-
86
-
87
-
88
-
89
-
90
-
91
-
92
-
93
-
94
-
95
-
96
-
97
-
98
-
99
-
100
-
101
-
102
-
103
-
104
-
105
-
106
-
107
-
108
-
109
-
110
-
111
-
112
-
113
-
114
-
115
-
116
-
117
-
118
-
119
-
120
-
121
-
122
-
123
-
124
-
125
-
126
-
127
-
128
-
129
-
130
-
131
-
132
-
133
-
134
-
135
-
136
-
137
-
138
-
139
-
140
-
141
-
142
-
143
-
144
-
145
-
146
-
147
-
148
-
149
-
150
-
151
-
152
-
153
-
154
-
155
-
156
-
157
-
158
-
159
-
160
-
161
-
162
-
163
-
164
-
165
-
166
-
167
-
168
-
169
-
170
-
171
-
172
-
173
-
174
-
175
-
176
-
177
-
178
-
179
-
180
-
181
-
182
-
183
-
184
-
185
-
186
-
187
-
188
-
189
-
190
-
191
-
192
-
193
-
194
-
195
-
196
-
197
-
198
-
199
-
200
-
201
-
202
-
203
-
204
-
205
-
206
-
207
-
208
-
209
-
210
-
211
-
212
-
213
-
214
-
215
-
216
-
217
-
218
-
219
-
220
-
221
-
222
-
223
-
224
-
225
-
226
-
227
-
228
-
229
-
230
-
231
-
232
-
233
-
234
-
235
-
236
-
237
-
238
-
239
-
240
-
241
-
242
-
243
-
244
-
245
-
246
-
247
-
248
-
249
-
250
-
251
-
252
-
253
-
254
-
255
-
256
-
257
-
258
-
259
-
260
-
261
-
262
-
263
-
264
-
265
-
266
-
267
-
268
-
269
-
270
-
271
-
272
-
273
-
274
-
275
-
276
-
277
-
278
-
279
-
280
-
281
-
282
-
283
-
284
-
285
-
286
-
287
-
288
-
289
-
290
 |
 |
2DEC200918175597
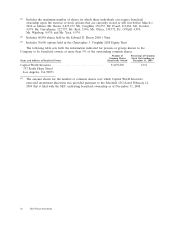
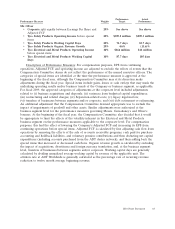
benefit and perquisite payments, and help the Compensation Committee to better understand the effect
that changing any discrete pay element will have on the total pay provided to each executive. This data
also clearly illustrates the effect that changing core elements of the executive compensation design
(base salary, target bonus and equity-based compensation) will have on our competitive positioning.
Tally sheets also reveal how well each pay element is aligned with our compensation philosophy and
objectives. In fiscal 2009, the tally sheets were expanded to show the value of all compensation
elements under multiple triggering events—voluntary and involuntary termination of employment, death
or disability, and change in control with or without termination of employment.
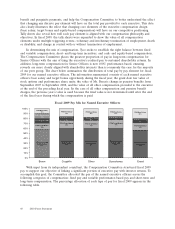
In determining the mix of compensation, Tyco seeks to establish the right balance between fixed
and variable compensation, short- and long-term incentives, and cash- and equity-based compensation.
The Compensation Committee places the greatest proportion of pay in long-term compensation for
Senior Officers with the aim of tying the executive’s realized pay to sustained shareholder returns. In
addition, long-term compensation for Senior Officers is now 100% performance-based, ensuring
rewards are more closely aligned with shareholder interests than is commonly the case for the majority
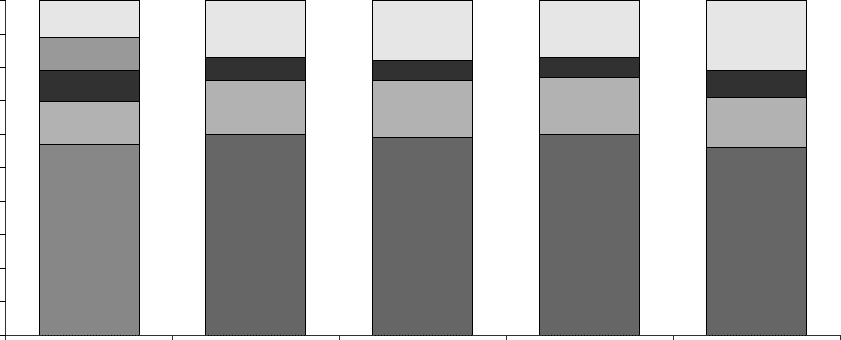
of our peer group. The chart below summarizes the distribution of total pay by pay element for fiscal
2009 for our named executive officers. The information summarized consists of each named executive
officer’s base salary and target bonus opportunity during the fiscal year; the grant date fair value of
stock options and performance share units; the value of Mr. Breen’s change in pension benefits from
September 2007 to September 2008, and the value of all other compensation provided to the executive
at the end of the preceding fiscal year. In the case of all other compensation and pension benefit
charges, the previous year’s value is used because the final value is not determined until after the end
of the fiscal year during which the compensation is paid.
Fiscal 2009 Pay Mix for Named Executive Officers
Breen Coughlin Oliver Gursahaney Evard
FY09 Share-based
Compensation
57%
FY09 Share-based
Compensation
60%
FY09 Share-based
Compensation
59%
FY09 Share-based
Compensation
60%
FY09 Share-based
Compensation
56%
FY09 Target Bonus
13%
FY09 Target Bonus
16% FY09 Target Bonus
17%
FY09 Target Bonus
17% FY09 Target Bonus
15%
FY08 All Other Comp
9%
FY08 All Other Comp
7%
FY08 All Other Comp
6%
FY08 All Other Comp
6% FY08 All Other Comp
8%
FY09 Base Salary
11% FY09 Base Salary
17%
FY09 Base Salary
18%
FY09 Base Salary
17%
FY09 Base Salary
21%
FY08 ∆ Pension Value,
10%
100%
90%
80%
70%
60%
50%
40%
30%
20%
10%
0%
With input from its independent consultant, the Compensation Committee structured fiscal 2009
pay to support our objective of linking a significant portion of executive pay with investor returns. To
accomplish this goal, the Committee allocated the pay of the named executive officers across the
following categories of compensation: fixed pay and variable performance-based pay and short-term and
long-term compensation. The percentage allocation of each type of pay for fiscal 2009 appears in the
following table.
40 2010 Proxy Statement