ADT 2009 Annual Report Download - page 252
Download and view the complete annual report
Please find page 252 of the 2009 ADT annual report below. You can navigate through the pages in the report by either clicking on the pages listed below, or by using the keyword search tool below to find specific information within the annual report.-
 1
1 -
2
-
3
-
4
-
5
-
6
-
7
-
8
-
9
-
10
-
11
-
12
-
13
-
14
-
15
-
16
-
17
-
18
-
19
-
20
-
21
-
22
-
23
-
24
-
25
-
26
-
27
-
28
-
29
-
30
-
31
-
32
-
33
-
34
-
35
-
36
-
37
-
38
-
39
-
40
-
41
-
42
-
43
-
44
-
45
-
46
-
47
-
48
-
49
-
50
-
51
-
52
-
53
-
54
-
55
-
56
-
57
-
58
-
59
-
60
-
61
-
62
-
63
-
64
-
65
-
66
-
67
-
68
-
69
-
70
-
71
-
72
-
73
-
74
-
75
-
76
-
77
-
78
-
79
-
80
-
81
-
82
-
83
-
84
-
85
-
86
-
87
-
88
-
89
-
90
-
91
-
92
-
93
-
94
-
95
-
96
-
97
-
98
-
99
-
100
-
101
-
102
-
103
-
104
-
105
-
106
-
107
-
108
-
109
-
110
-
111
-
112
-
113
-
114
-
115
-
116
-
117
-
118
-
119
-
120
-
121
-
122
-
123
-
124
-
125
-
126
-
127
-
128
-
129
-
130
-
131
-
132
-
133
-
134
-
135
-
136
-
137
-
138
-
139
-
140
-
141
-
142
-
143
-
144
-
145
-
146
-
147
-
148
-
149
-
150
-
151
-
152
-
153
-
154
-
155
-
156
-
157
-
158
-
159
-
160
-
161
-
162
-
163
-
164
-
165
-
166
-
167
-
168
-
169
-
170
-
171
-
172
-
173
-
174
-
175
-
176
-
177
-
178
-
179
-
180
-
181
-
182
-
183
-
184
-
185
-
186
-
187
-
188
-
189
-
190
-
191
-
192
-
193
-
194
-
195
-
196
-
197
-
198
-
199
-
200
-
201
-
202
-
203
-
204
-
205
-
206
-
207
-
208
-
209
-
210
-
211
-
212
-
213
-
214
-
215
-
216
-
217
-
218
-
219
-
220
-
221
-
222
-
223
-
224
-
225
-
226
-
227
-
228
-
229
-
230
-
231
-
232
-
233
-
234
-
235
-
236
-
237
-
238
-
239
-
240
-
241
-
 242
242 -
 243
243 -
 244
244 -
 245
245 -
 246
246 -
 247
247 -
 248
248 -
 249
249 -
 250
250 -
 251
251 -
 252
252 -
 253
253 -
 254
254 -
 255
255 -
 256
256 -
 257
257 -
 258
258 -
 259
259 -
 260
260 -
 261
261 -
 262
262 -
263
-
264
-
265
-
266
-
267
-
268
-
269
-
270
-
271
-
272
-
273
-
274
-
275
-
276
-
277
-
278
-
279
-
280
-
281
-
282
-
283
-
284
-
285
-
286
-
287
-
288
-
289
-
290
 |
 |

TYCO INTERNATIONAL LTD.
NOTES TO CONSOLIDATED FINANCIAL STATEMENTS
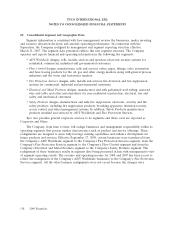
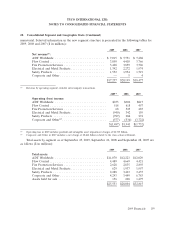
20. Consolidated Segment and Geographic Data (Continued)
Depreciation and amortization and capital expenditures, net by segment for the years ended
September 25, 2009, September 26, 2008 and September 28, 2007 are as follows ($ in millions):
2009 2008 2007
Depreciation and amortization:
ADT Worldwide ............................... $ 878 $ 909 $ 924
Flow Control ................................. 69 65 62
Fire Protection Services ......................... 34 31 31
Electrical and Metal Products ..................... 30 37 27
Safety Products ............................... 110 102 94
Corporate and Other ........................... 12 10 10
$1,133 $1,154 $1,148
2009 2008 2007
Capital expenditures:
ADT Worldwide .................................. $421 $494 $459
Flow Control ..................................... 107 130 90
Fire Protection Services ............................. 25 28 26
Electrical and Metal Products ......................... 46 35 29
Safety Products ................................... 78 41 51
Corporate and Other ............................... 32 6 11
$709 $734 $666
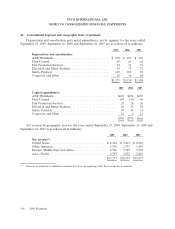
Net revenue by geographic area for the years ended September 25, 2009, September 26, 2008 and
September 28, 2007 is as follows ($ in millions):
2009 2008 2007
Net revenue(1):
United States .............................. $ 8,304 $ 9,465 $ 8,910
Other Americas ............................. 1,520 1,733 1,419
Europe, Middle East and Africa ................. 4,706 5,749 5,338
Asia—Pacific ............................... 2,707 3,252 2,810
$17,237 $20,199 $18,477
(1) Revenue is attributed to individual countries based on the reporting entity that records the transaction.
160 2009 Financials