ADT 2009 Annual Report Download - page 288
Download and view the complete annual report
Please find page 288 of the 2009 ADT annual report below. You can navigate through the pages in the report by either clicking on the pages listed below, or by using the keyword search tool below to find specific information within the annual report.-
 1
1 -
2
-
3
-
4
-
5
-
6
-
7
-
8
-
9
-
10
-
11
-
12
-
13
-
14
-
15
-
16
-
17
-
18
-
19
-
20
-
21
-
22
-
23
-
24
-
25
-
26
-
27
-
28
-
29
-
30
-
31
-
32
-
33
-
34
-
35
-
36
-
37
-
38
-
39
-
40
-
41
-
42
-
43
-
44
-
45
-
46
-
47
-
48
-
49
-
50
-
51
-
52
-
53
-
54
-
55
-
56
-
57
-
58
-
59
-
60
-
61
-
62
-
63
-
64
-
65
-
66
-
67
-
68
-
69
-
70
-
71
-
72
-
73
-
74
-
75
-
76
-
77
-
78
-
79
-
80
-
81
-
82
-
83
-
84
-
85
-
86
-
87
-
88
-
89
-
90
-
91
-
92
-
93
-
94
-
95
-
96
-
97
-
98
-
99
-
100
-
101
-
102
-
103
-
104
-
105
-
106
-
107
-
108
-
109
-
110
-
111
-
112
-
113
-
114
-
115
-
116
-
117
-
118
-
119
-
120
-
121
-
122
-
123
-
124
-
125
-
126
-
127
-
128
-
129
-
130
-
131
-
132
-
133
-
134
-
135
-
136
-
137
-
138
-
139
-
140
-
141
-
142
-
143
-
144
-
145
-
146
-
147
-
148
-
149
-
150
-
151
-
152
-
153
-
154
-
155
-
156
-
157
-
158
-
159
-
160
-
161
-
162
-
163
-
164
-
165
-
166
-
167
-
168
-
169
-
170
-
171
-
172
-
173
-
174
-
175
-
176
-
177
-
178
-
179
-
180
-
181
-
182
-
183
-
184
-
185
-
186
-
187
-
188
-
189
-
190
-
191
-
192
-
193
-
194
-
195
-
196
-
197
-
198
-
199
-
200
-
201
-
202
-
203
-
204
-
205
-
206
-
207
-
208
-
209
-
210
-
211
-
212
-
213
-
214
-
215
-
216
-
217
-
218
-
219
-
220
-
221
-
222
-
223
-
224
-
225
-
226
-
227
-
228
-
229
-
230
-
231
-
232
-
233
-
234
-
235
-
236
-
237
-
238
-
239
-
240
-
241
-
242
-
243
-
244
-
245
-
246
-
247
-
248
-
249
-
250
-
251
-
252
-
253
-
254
-
255
-
256
-
257
-
258
-
259
-
260
-
261
-
262
-
263
-
264
-
265
-
266
-
267
-
268
-
269
-
270
-
271
-
272
-
273
-
274
-
275
-
276
-
277
-
 278
278 -
 279
279 -
 280
280 -
 281
281 -
 282
282 -
 283
283 -
 284
284 -
 285
285 -
 286
286 -
 287
287 -
 288
288 -
 289
289 -
 290
290
 |
 |

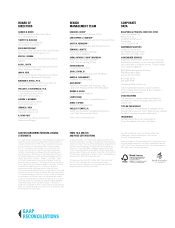
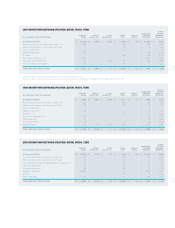
2008 ORGANIC REVENUE RECONCILIATION
ORGANIC
2007 NET ACQUISITION / FOREIGN ORGANIC 2008 NET REVENUE
( IN US$ MILLIONS ) REVENUES DIVESTITURE CURRENCY OTHER REVENUE REVENUES GROWTH %
ADT Worldwide $ 7,288 $ 49 $ 204 $ 69 $ 121 $ 7,731 1.7%
Flow Control 3,766 16 314 ( 10 ) 332 4,418 8.8%
Fire Protection Services 3,726 — 134 (91) 70 3,839 1.9%
Electrical & Metal Products 1,974 1 44 — 253 2,272 12.8%
Safety Products 1,719 1 76 — 138 1,934 8.0%
Corporate and Other 4 — — — 1 5 25.0%
TOTAL $ 18,477 $ 67 $ 772 $ ( 32 ) $ 915 $ 20,199 5.0%
2009 ORGANIC REVENUE RECONCILIATION
ORGANIC
2008 NET ACQUISITION / FOREIGN ORGANIC 2009 NET REVENUE
( IN US$ MILLIONS ) REVENUES DIVESTITURE CURRENCY OTHER REVENUE REVENUES GROWTH %
ADT Worldwide $ 7,731 $ 152 $ (590) $ — $ (278) $ 7,015 (3.6)%
Flow Control 4,418 (3) (462) 26 (129) 3,850 (2.9)%
Fire Protection Services 3,839 — (294) (18) (99) 3,428 (2.6)%
Electrical & Metal Products 2,272 (31) (52) (12) (785) 1,392 (34.6)%
Safety Products 1,934 (8) (122) 12 (264) 1,552 (13.7)%
Corporate and Other 5 — — — (5) — (100.0)%
TOTAL $ 20,199 $ 110 $ (1,520) $ 8 $ (1,560) $ 17,237 (7.7)%
2007 ORGANIC REVENUE RECONCILIATION
ORGANIC
2006 NET ACQUISITION / FOREIGN ORGANIC 2007 NET REVENUE
( IN US$ MILLIONS ) REVENUES DIVESTITURE CURRENCY OTHER REVENUE REVENUES GROWTH %
ADT Worldwide $ 6,895 $ ( 3 ) $ 186 $ ( 21 ) $ 231 $ 7,288 3.4%
Flow Control 3,135 ( 16 ) 197 — 450 3,766 14.4%
Fire Protection Services 3,460 ( 30 ) 128 — 168 3,726 4.9%
Electrical & Metal Products 1,949 1 20 — 4 1,974 0.2%
Safety Products 1,624 — 49 — 46 1,719 2.8%
Corporate and Other 3 — — — 1 4 33.3%
TOTAL $ 17,066 $ ( 48 ) $ 580 $ ( 21 ) $ 900 $ 18,477 5.3%
NON-GAAP MEASURES
“Organic revenue,” “operating margin before special
items,” “income from continuing operations before special
items,” and “diluted EPS from continuing operations before
special items” are non-GAAP measures and should not be
considered replacements for GAAP results.
Organic revenue is a useful measure used by the company to
measure the underlying results and trends in the business.
The difference between reported net revenue (the most
comparable GAAP measure) and organic revenue (the non-
GAAP measure) consists of the impact from foreign currency,
acquisitions and divestitures, and other changes that do not
reflect underlying results and trends. Organic revenue is a
useful measure of the company’s performance because it
excludes items that: i) are not completely under management’s
control, such as the impact of foreign currency exchange; or
ii) do not reflect the underlying growth of the company, such
as acquisition and divestiture activity. It may be used as a
component of the company’s compensation programs. The
limitation of this measure is that it excludes items that have
an impact on the company’s revenue. This limitation is best
addressed by using organic revenue in combination with the
GAAP numbers.
The company has presented its operating margin, income
from continuing operations and diluted EPS from continuing
operations before special items. Special items include
charges and gains that may mask the underlying operating
results and/or business trends of the company or business
segment, as applicable. The company utilizes these financial
measures before special items to assess overall operating
performance and segment-level core operating performance,
and to provide insight to management in evaluating overall
and segment operating plan execution and underlying market
conditions. Income from continuing operations before special
items may also be a significant component in the company’s
incentive compensation plans. Operating margin, income
from continuing operations and diluted EPS from continuing
operations before special items are useful measures for
investors because they permit more meaningful comparisons
of the company’s underlying operating results and business
trends between periods. The difference between these
measures and the most comparable GAAP measures
(operating margin, income from continuing operations
and diluted EPS from continuing operations) consists of
the impact of charges and gains related to divestitures,
acquisitions, restructurings, impairments, legacy legal and
tax charges, and other income or charges that may mask
the underlying operating results and/or business trends.
The limitation of these measures is that they exclude the
impact (which may be material) of items that increase or
decrease the company’s reported income from continuing
operations, operating margin and EPS from continuing
operations. This limitation is best addressed by using these
financial measures in combination with the most comparable
GAAP measures in order to better understand the amounts,
character and impact of any increase or decrease on
reported results.