ADT 2009 Annual Report Download - page 136
Download and view the complete annual report
Please find page 136 of the 2009 ADT annual report below. You can navigate through the pages in the report by either clicking on the pages listed below, or by using the keyword search tool below to find specific information within the annual report.-
 1
1 -
2
-
3
-
4
-
5
-
6
-
7
-
8
-
9
-
10
-
11
-
12
-
13
-
14
-
15
-
16
-
17
-
18
-
19
-
20
-
21
-
22
-
23
-
24
-
25
-
26
-
27
-
28
-
29
-
30
-
31
-
32
-
33
-
34
-
35
-
36
-
37
-
38
-
39
-
40
-
41
-
42
-
43
-
44
-
45
-
46
-
47
-
48
-
49
-
50
-
51
-
52
-
53
-
54
-
55
-
56
-
57
-
58
-
59
-
60
-
61
-
62
-
63
-
64
-
65
-
66
-
67
-
68
-
69
-
70
-
71
-
72
-
73
-
74
-
75
-
76
-
77
-
78
-
79
-
80
-
81
-
82
-
83
-
84
-
85
-
86
-
87
-
88
-
89
-
90
-
91
-
92
-
93
-
94
-
95
-
96
-
97
-
98
-
99
-
100
-
101
-
102
-
103
-
104
-
105
-
106
-
107
-
108
-
109
-
110
-
111
-
112
-
113
-
114
-
115
-
116
-
117
-
118
-
119
-
120
-
121
-
122
-
123
-
124
-
125
-
 126
126 -
 127
127 -
 128
128 -
 129
129 -
 130
130 -
 131
131 -
 132
132 -
 133
133 -
 134
134 -
 135
135 -
 136
136 -
 137
137 -
 138
138 -
 139
139 -
 140
140 -
 141
141 -
 142
142 -
 143
143 -
 144
144 -
 145
145 -
 146
146 -
147
-
148
-
149
-
150
-
151
-
152
-
153
-
154
-
155
-
156
-
157
-
158
-
159
-
160
-
161
-
162
-
163
-
164
-
165
-
166
-
167
-
168
-
169
-
170
-
171
-
172
-
173
-
174
-
175
-
176
-
177
-
178
-
179
-
180
-
181
-
182
-
183
-
184
-
185
-
186
-
187
-
188
-
189
-
190
-
191
-
192
-
193
-
194
-
195
-
196
-
197
-
198
-
199
-
200
-
201
-
202
-
203
-
204
-
205
-
206
-
207
-
208
-
209
-
210
-
211
-
212
-
213
-
214
-
215
-
216
-
217
-
218
-
219
-
220
-
221
-
222
-
223
-
224
-
225
-
226
-
227
-
228
-
229
-
230
-
231
-
232
-
233
-
234
-
235
-
236
-
237
-
238
-
239
-
240
-
241
-
242
-
243
-
244
-
245
-
246
-
247
-
248
-
249
-
250
-
251
-
252
-
253
-
254
-
255
-
256
-
257
-
258
-
259
-
260
-
261
-
262
-
263
-
264
-
265
-
266
-
267
-
268
-
269
-
270
-
271
-
272
-
273
-
274
-
275
-
276
-
277
-
278
-
279
-
280
-
281
-
282
-
283
-
284
-
285
-
286
-
287
-
288
-
289
-
290
 |
 |

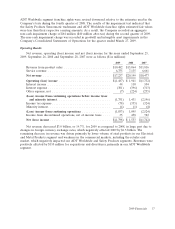
Safety Products
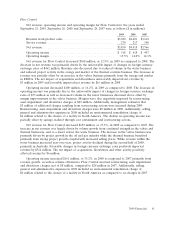
Net revenue, goodwill and intangible asset impairments, operating income and operating margin
for Safety Products for the years ended September 25, 2009, September 26, 2008 and September 28,
2007 were as follows ($ in millions):
2009 2008 2007
Revenue from product sales ............................. $1,536 $1,916 $1,704
Service revenue ...................................... 16 18 15
Net revenue ........................................ $1,552 $1,934 $1,719
Goodwill and intangible asset impairments .................. $ 955 $ — $ 7
Operating (loss) income ................................ (789) 284 274
Operating margin ..................................... —
(1) 14.7% 15.9%
(1) Certain operating margins have not been presented as management believes such calculations are not meaningful.
Net revenue for Safety Products decreased $382 million, or 19.8%, during 2009 as compared to
2008. The decrease is primarily related to reduced volume in our fire suppression business, life safety
and electronic security businesses, which continued to be impacted by the soft economic conditions.
The remaining decrease is related to the unfavorable impact of changes in foreign currency exchange
rates of $122 million. The decrease in our fire suppression business was primarily due to reduced
spending in the commercial construction market. The decrease in the life safety business was primarily
due to reduced municipal spending. The electronic security business decrease was primarily due to the
slow down in the retail sector, as retail capital projects and new store openings were canceled or
delayed.
Operating income decreased $1.1 billion in 2009 as compared to 2008. The decline is primarily
attributable to goodwill and intangible impairment charges of $955 million recorded during the quarter
ended March 27, 2009 as a result of the continued slowdown in the commercial and retail markets. As
discussed above, decreased sales volume within the fire suppression, life safety and electronic security
businesses also negatively impacted operating income. Operating income was negatively impacted by
restructuring, asset impairment and divestiture charges of $46 million during 2009. Additionally,
management estimates that $9 million of additional charges resulting from restructuring actions were
incurred during 2009. The same period in the prior year included $73 million of restructuring and asset
impairment charges. Operating income also decreased by $18 million due to unfavorable changes in
foreign currency exchange rates. Operating income was also negatively impacted by a charge of
$8 million relating to the amount of depreciation and amortization expense that would have been
recorded had a business that was previously classified as held for sale been continuously classified as
held and used (see Note 2 to the Consolidated Financial Statements).
Net revenue for Safety Products increased $215 million, or 12.5%, during 2008 as compared to
2007 primarily from strong performance in the fire suppression, and to a lesser extent electronic
security and life safety businesses. The increase in the fire suppression business was driven by continued
growth in the energy and marine sectors, favorable product mix and increased selling prices to offset
increasing raw material costs. The increase in the life safety business was primarily driven by growth in
North America as a result of increased spending by fire departments and from increased selling prices.
The increase in the electronic security business was partially due to higher volume and new product
introductions primarily related to casinos and schools. Favorable changes in foreign currency exchange
rates of $76 million also contributed to the increase in revenue.
Operating income increased $10 million, or 3.6% in 2008 as compared to 2007. The increase in
operating income was primarily attributable to increased sales volume along with the impact of cost
44 2009 Financials