ADT 2009 Annual Report Download - page 79
Download and view the complete annual report
Please find page 79 of the 2009 ADT annual report below. You can navigate through the pages in the report by either clicking on the pages listed below, or by using the keyword search tool below to find specific information within the annual report.-
 1
1 -
2
-
3
-
4
-
5
-
6
-
7
-
8
-
9
-
10
-
11
-
12
-
13
-
14
-
15
-
16
-
17
-
18
-
19
-
20
-
21
-
22
-
23
-
24
-
25
-
26
-
27
-
28
-
29
-
30
-
31
-
32
-
33
-
34
-
35
-
36
-
37
-
38
-
39
-
40
-
41
-
42
-
43
-
44
-
45
-
46
-
47
-
48
-
49
-
50
-
51
-
52
-
53
-
54
-
55
-
56
-
57
-
58
-
59
-
60
-
61
-
62
-
63
-
64
-
65
-
66
-
67
-
68
-
 69
69 -
 70
70 -
 71
71 -
 72
72 -
 73
73 -
 74
74 -
 75
75 -
 76
76 -
 77
77 -
 78
78 -
 79
79 -
 80
80 -
 81
81 -
 82
82 -
 83
83 -
 84
84 -
 85
85 -
 86
86 -
 87
87 -
 88
88 -
 89
89 -
90
-
91
-
92
-
93
-
94
-
95
-
96
-
97
-
98
-
99
-
100
-
101
-
102
-
103
-
104
-
105
-
106
-
107
-
108
-
109
-
110
-
111
-
112
-
113
-
114
-
115
-
116
-
117
-
118
-
119
-
120
-
121
-
122
-
123
-
124
-
125
-
126
-
127
-
128
-
129
-
130
-
131
-
132
-
133
-
134
-
135
-
136
-
137
-
138
-
139
-
140
-
141
-
142
-
143
-
144
-
145
-
146
-
147
-
148
-
149
-
150
-
151
-
152
-
153
-
154
-
155
-
156
-
157
-
158
-
159
-
160
-
161
-
162
-
163
-
164
-
165
-
166
-
167
-
168
-
169
-
170
-
171
-
172
-
173
-
174
-
175
-
176
-
177
-
178
-
179
-
180
-
181
-
182
-
183
-
184
-
185
-
186
-
187
-
188
-
189
-
190
-
191
-
192
-
193
-
194
-
195
-
196
-
197
-
198
-
199
-
200
-
201
-
202
-
203
-
204
-
205
-
206
-
207
-
208
-
209
-
210
-
211
-
212
-
213
-
214
-
215
-
216
-
217
-
218
-
219
-
220
-
221
-
222
-
223
-
224
-
225
-
226
-
227
-
228
-
229
-
230
-
231
-
232
-
233
-
234
-
235
-
236
-
237
-
238
-
239
-
240
-
241
-
242
-
243
-
244
-
245
-
246
-
247
-
248
-
249
-
250
-
251
-
252
-
253
-
254
-
255
-
256
-
257
-
258
-
259
-
260
-
261
-
262
-
263
-
264
-
265
-
266
-
267
-
268
-
269
-
270
-
271
-
272
-
273
-
274
-
275
-
276
-
277
-
278
-
279
-
280
-
281
-
282
-
283
-
284
-
285
-
286
-
287
-
288
-
289
-
290
 |
 |

2010 Proxy Statement 59
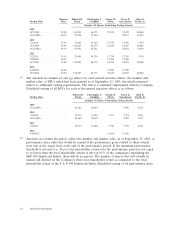
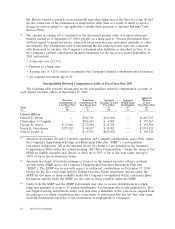
Grants of Plan-Based Awards Table
The following table summarizes cash-based and equity-based awards for each of the Company’s named executive officers that were
granted during fiscal 2009 under the 2004 SIP.
All Other
Stock All Other Grant
Extimated Possible Payouts Estimated Possible Payouts Awards: Option Date
Under Non-Equity Incentive Plan Under Equity Incentive Plan Number of Awards: Exercise or Fair Value
Awards(1) Awards(2) Shares Number of Base of Stock
Target of Stock Securities Price of and
(Mid- or Underlying Option Option
Grant Threshold Target Maximum Threshold Point) Maximum Units Options Awards Awards
Name Date ($) ($) ($) (#) (#) (#) (#) (#) ($/Sh) ($)(3)
(a) (b) (c) (d) (e) (f) (g) (h) (i) (j) (k) (l)
Current Officers
Edward D. Breen .......... 12/3/2008 $1,015,625 $2,031,250 $4,062,500
10/7/2008 62,040 155,100 310,200 $8,635,968
10/7/2008 554,100 $29 $4,313,724
Christopher J. Coughlin ...... 12/3/2008 $ 400,000 $ 800,000 $1,600,000
10/7/2008 20,680 51,700 103,400 $2,878,656
10/7/2008 184,700 $29 $1,437,908
George R. Oliver .......... 12/3/2008 $ 300,000 $ 600,000 $1,200,000
10/7/2008 14,480 36,200 72,400 $2,015,616
10/7/2008 129,300 $29 $1,006,613
Naren K. Gursahaney ....... 12/3/2008 $ 280,000 $ 560,000 $1,120,000
10/7/2008 14,480 36,200 72,400 $2,015,616
10/7/2008 129,300 $29 $1,006,613
John E. Evard, Jr. ......... 12/3/2008 $ 172,500 $ 345,000 $ 690,000
10/7/2008 8,960 22,400 44,800 $1,247,232
10/7/2008 80,000 $29 $ 622,808
(1) Amounts reported in columns (c) through (e) represent potential annual performance bonuses that the named executive officers could have
earned under the Company’s annual incentive plan for fiscal 2009. The Board approved a maximum bonus payout of 0.50% of net income
before special items for Mr. Breen, subject to a cap of $5.0 million imposed by the 2004 SIP, and 0.25% for the other Senior Officers, subject
to a cap of $2.5 million. The Compensation Committee further established a maximum payout of 200% of target. Threshold amounts assume
minimum performance levels are achieved with respect to each performance measure.
(2) Amounts in (f) through (h) represent potential share payouts with respect to performance share awards that were made in connection with
the fiscal year 2009 long-term compensation grant. Performance share units were granted to certain executive officers in October 2008 and
vest at the end of the three-year performance period on September 30, 2011. The number of shares that will be paid out will depend on the
Company’s three-year annualized total shareholder return over the performance period, as compared to the return for the S&P 500 Industrials
Index.
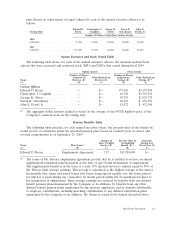
(3) Amounts in column (l) show the grant date fair value of the option awards and performance share awards granted to named executive
officers. Amounts for performance share awards were calculated assuming the maximum number of shares are earned under the awards. The
actual number of shares that are paid out will depend on the Company’s three-year annualized total shareholder return over the performance
period, as compared to the return for the S&P 500 Industrials Index.