ADT 2009 Annual Report Download - page 239
Download and view the complete annual report
Please find page 239 of the 2009 ADT annual report below. You can navigate through the pages in the report by either clicking on the pages listed below, or by using the keyword search tool below to find specific information within the annual report.-
 1
1 -
2
-
3
-
4
-
5
-
6
-
7
-
8
-
9
-
10
-
11
-
12
-
13
-
14
-
15
-
16
-
17
-
18
-
19
-
20
-
21
-
22
-
23
-
24
-
25
-
26
-
27
-
28
-
29
-
30
-
31
-
32
-
33
-
34
-
35
-
36
-
37
-
38
-
39
-
40
-
41
-
42
-
43
-
44
-
45
-
46
-
47
-
48
-
49
-
50
-
51
-
52
-
53
-
54
-
55
-
56
-
57
-
58
-
59
-
60
-
61
-
62
-
63
-
64
-
65
-
66
-
67
-
68
-
69
-
70
-
71
-
72
-
73
-
74
-
75
-
76
-
77
-
78
-
79
-
80
-
81
-
82
-
83
-
84
-
85
-
86
-
87
-
88
-
89
-
90
-
91
-
92
-
93
-
94
-
95
-
96
-
97
-
98
-
99
-
100
-
101
-
102
-
103
-
104
-
105
-
106
-
107
-
108
-
109
-
110
-
111
-
112
-
113
-
114
-
115
-
116
-
117
-
118
-
119
-
120
-
121
-
122
-
123
-
124
-
125
-
126
-
127
-
128
-
129
-
130
-
131
-
132
-
133
-
134
-
135
-
136
-
137
-
138
-
139
-
140
-
141
-
142
-
143
-
144
-
145
-
146
-
147
-
148
-
149
-
150
-
151
-
152
-
153
-
154
-
155
-
156
-
157
-
158
-
159
-
160
-
161
-
162
-
163
-
164
-
165
-
166
-
167
-
168
-
169
-
170
-
171
-
172
-
173
-
174
-
175
-
176
-
177
-
178
-
179
-
180
-
181
-
182
-
183
-
184
-
185
-
186
-
187
-
188
-
189
-
190
-
191
-
192
-
193
-
194
-
195
-
196
-
197
-
198
-
199
-
200
-
201
-
202
-
203
-
204
-
205
-
206
-
207
-
208
-
209
-
210
-
211
-
212
-
213
-
214
-
215
-
216
-
217
-
218
-
219
-
220
-
221
-
222
-
223
-
224
-
225
-
226
-
227
-
228
-
 229
229 -
 230
230 -
 231
231 -
 232
232 -
 233
233 -
 234
234 -
 235
235 -
 236
236 -
 237
237 -
 238
238 -
 239
239 -
 240
240 -
 241
241 -
 242
242 -
 243
243 -
 244
244 -
 245
245 -
 246
246 -
 247
247 -
 248
248 -
 249
249 -
250
-
251
-
252
-
253
-
254
-
255
-
256
-
257
-
258
-
259
-
260
-
261
-
262
-
263
-
264
-
265
-
266
-
267
-
268
-
269
-
270
-
271
-
272
-
273
-
274
-
275
-
276
-
277
-
278
-
279
-
280
-
281
-
282
-
283
-
284
-
285
-
286
-
287
-
288
-
289
-
290
 |
 |

TYCO INTERNATIONAL LTD.
NOTES TO CONSOLIDATED FINANCIAL STATEMENTS
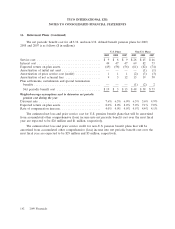
16. Retirement Plans (Continued)
life insurance policies. During fiscal year 2007, the Company, as permitted under the trust agreement,
sold substantially all of its assets held in the trusts and received $271 million of proceeds. The
remaining trust assets were not material as of September 25, 2009 and September 26, 2008. The trust
assets, which are consolidated, are subject to the claims of the Company’s creditors in the event of the
Company’s insolvency. Plan participants are general creditors of the Company with respect to these
benefits.
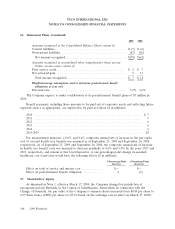
Postretirement Benefit Plans—The Company generally does not provide postretirement benefits
other than pensions for its employees. However, certain acquired operations provide these benefits to
employees who were eligible at the date of acquisition, and a small number of U.S. and Canadian
operations provide ongoing eligibility for such benefits.
Net periodic postretirement benefit cost for 2009, 2008 and 2007 is as follows ($ in millions):
2009 2008 2007
Service cost ........................................ $— $— $—
Interest cost ....................................... 4 4 4
Amortization of prior service credit ....................... (1) — (1)
Amortization of net actuarial gain ........................ (1) (1) (2)
Net periodic postretirement benefit cost ................... $2 $3 $1
Weighted-average assumptions used to determine net periodic
postretirement benefit cost during the period:
Discount rate ....................................... 7.4% 6.1% 5.7%
The components of the accrued postretirement benefit obligations, substantially all of which are
unfunded as of September 25, 2009 and September 26, 2008, are as follows ($ in millions):
2009 2008
Change in benefit obligations:
Benefit obligations as of beginning of year ..................... $63 $69
Service cost ............................................ — —
Interest cost ........................................... 4 4
Actuarial loss (gain) ..................................... 6 (3)
Acquisitions and mergers .................................. 4 —
Benefits paid ........................................... (7) (7)
Benefit obligations as of end of year ........................ $70 $63
Change in plan assets:
Fair value of plan assets as of beginning of year ................. $— $—
Employer contributions ................................... 7 7
Benefits paid ........................................... (7) (7)
Fair value of plan assets as of end of year .................... $— $—
Funded status .......................................... $(70) $(63)
Contributions after the measurement date ...................... — 1
Net amount recognized ................................... $(70) $(62)
2009 Financials 147