ADT 2009 Annual Report Download - page 206
Download and view the complete annual report
Please find page 206 of the 2009 ADT annual report below. You can navigate through the pages in the report by either clicking on the pages listed below, or by using the keyword search tool below to find specific information within the annual report.-
 1
1 -
2
-
3
-
4
-
5
-
6
-
7
-
8
-
9
-
10
-
11
-
12
-
13
-
14
-
15
-
16
-
17
-
18
-
19
-
20
-
21
-
22
-
23
-
24
-
25
-
26
-
27
-
28
-
29
-
30
-
31
-
32
-
33
-
34
-
35
-
36
-
37
-
38
-
39
-
40
-
41
-
42
-
43
-
44
-
45
-
46
-
47
-
48
-
49
-
50
-
51
-
52
-
53
-
54
-
55
-
56
-
57
-
58
-
59
-
60
-
61
-
62
-
63
-
64
-
65
-
66
-
67
-
68
-
69
-
70
-
71
-
72
-
73
-
74
-
75
-
76
-
77
-
78
-
79
-
80
-
81
-
82
-
83
-
84
-
85
-
86
-
87
-
88
-
89
-
90
-
91
-
92
-
93
-
94
-
95
-
96
-
97
-
98
-
99
-
100
-
101
-
102
-
103
-
104
-
105
-
106
-
107
-
108
-
109
-
110
-
111
-
112
-
113
-
114
-
115
-
116
-
117
-
118
-
119
-
120
-
121
-
122
-
123
-
124
-
125
-
126
-
127
-
128
-
129
-
130
-
131
-
132
-
133
-
134
-
135
-
136
-
137
-
138
-
139
-
140
-
141
-
142
-
143
-
144
-
145
-
146
-
147
-
148
-
149
-
150
-
151
-
152
-
153
-
154
-
155
-
156
-
157
-
158
-
159
-
160
-
161
-
162
-
163
-
164
-
165
-
166
-
167
-
168
-
169
-
170
-
171
-
172
-
173
-
174
-
175
-
176
-
177
-
178
-
179
-
180
-
181
-
182
-
183
-
184
-
185
-
186
-
187
-
188
-
189
-
190
-
191
-
192
-
193
-
194
-
195
-
 196
196 -
 197
197 -
 198
198 -
 199
199 -
 200
200 -
 201
201 -
 202
202 -
 203
203 -
 204
204 -
 205
205 -
 206
206 -
 207
207 -
 208
208 -
 209
209 -
 210
210 -
 211
211 -
 212
212 -
 213
213 -
 214
214 -
 215
215 -
 216
216 -
217
-
218
-
219
-
220
-
221
-
222
-
223
-
224
-
225
-
226
-
227
-
228
-
229
-
230
-
231
-
232
-
233
-
234
-
235
-
236
-
237
-
238
-
239
-
240
-
241
-
242
-
243
-
244
-
245
-
246
-
247
-
248
-
249
-
250
-
251
-
252
-
253
-
254
-
255
-
256
-
257
-
258
-
259
-
260
-
261
-
262
-
263
-
264
-
265
-
266
-
267
-
268
-
269
-
270
-
271
-
272
-
273
-
274
-
275
-
276
-
277
-
278
-
279
-
280
-
281
-
282
-
283
-
284
-
285
-
286
-
287
-
288
-
289
-
290
 |
 |

TYCO INTERNATIONAL LTD.
NOTES TO CONSOLIDATED FINANCIAL STATEMENTS
6. Income Taxes (Continued)
such subsidiaries are ultimately disposed. It is not practicable to estimate the additional income taxes
related to permanently reinvested earnings or the basis differences related to investments in
subsidiaries.
The calculation of our tax liabilities involves dealing with uncertainties in the application of
complex tax regulations in a multitude of jurisdictions across our global operations. The Company
records tax liabilities for anticipated tax audit issues in the U.S. and other tax jurisdictions based on our
estimate of whether, and the extent to which, additional taxes will be due. These tax liabilities are
reflected net of related tax loss carryforwards. The Company adjusts these reserves in light of changing
facts and circumstances; however, due to the complexity of some of these uncertainties, the ultimate
resolution may result in a payment that is materially different from the Company’s current estimate of
the tax liabilities. If the Company’s estimate of tax liabilities proves to be less than the ultimate
assessment, an additional charge to expense would result. If payment of these amounts ultimately
proves to be less than the recorded amounts, the reversal of the liabilities may result in income tax
benefits being recognized in the period when we determine the liabilities are no longer necessary.
Substantially all of these potential tax liabilities are recorded in other liabilities in the Consolidated
Balance Sheets as payment is not expected within one year.
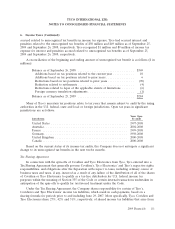
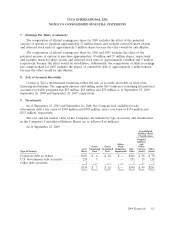
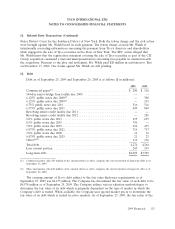
7. Earnings Per Share
As discussed in Note 1, in 2007 the Company effected a reverse stock split of Tyco’s common
shares, at a split ratio of 1-for-4. The reconciliations between basic and diluted earnings per share for
2009, 2008 and 2007 are as follows ($ in millions, except per share data):
2009 2008 2007
Per Share Per Share Per Share
Loss Shares Amount Income Shares Amount Loss Shares Amount
Basic earnings per share:
(Loss) income from
continuing operations . . . $(1,833) 473 $(3.87) $1,095 484 $2.26 $(2,524) 495 $(5.10)
Share options, restricted
share awards and deferred
stock units ........... — — — 3 — —
Exchange of convertible
debt ................ — — 1 1 — —
Diluted earnings per share:
(Loss) income from
continuing operations,
giving effect to dilutive
adjustments ........... $(1,833) 473 $(3.87) $1,096 488 $2.25 $(2,524) 495 $(5.10)
114 2009 Financials